Differential expression analysis for datasets of a compendium
Source:R/ea.R, R/io.R, R/visualize.R
runDE.RdThis function applies selected methods for differential expression (DE) analysis to selected datasets of an expression data compendium.
Arguments
- exp.list
Experiment list. A
listof datasets, each being of classSummarizedExperiment.- de.method
Differential expression method. See documentation of
deAna.- padj.method
Method for adjusting p-values to multiple testing. For available methods see the man page of the stats function
p.adjust. Defaults to 'flexible', which applies a dataset-specific correction strategy. See details.- parallel
Parallel computation mode. An instance of class
BiocParallelParam. See the vignette of theBiocParallelpackage for switching between serial, multi-core, and grid execution. Defaults toNULL, which then uses the first element ofBiocParallel::registered()for execution. If not changed by the user, this accordingly defaults to multi-core execution on the local host.- ...
Additional arguments passed to
EnrichmentBrowser::deAna.- max.na
Integer. Determines for which genes a meta fold change is computed. Per default, excludes genes for which the fold change is not annotated in >= 1/3 of the datasets in
exp.list.- out.dir
Character. Determines the output directory where DE results for each dataset are written to. Defaults to
NULL, which then writes to a subdir named 'de' intools::R_user_dir("GSEABenchmarkeR").- alpha
Statistical significance level. Defaults to 0.05.
- beta
Absolute log2 fold change cut-off. Defaults to 1 (2-fold).
Value
runDE returns exp.list with DE measures annotated to
the rowData slot of each dataset, writeDE writes to file,
and plotDEDistribution plots to a graphics device.
Details
DE studies typically report a gene as differentially expressed if the corresponding DE p-value, corrected for multiple testing, satisfies the chosen significance level. Enrichment methods that work directly on the list of DE genes are then substantially influenced by the multiple testing correction.
An example is the frequently used over-representation analysis (ORA), which
assesses the overlap between the DE genes and a gene set under study based
on the hypergeometric distribution (see Appendix A of the
EnrichmentBrowser vignette for an introduction).
ORA is inapplicable if there are few genes satisfying the significance threshold, or if almost all genes are DE.
Using padj.method="flexible" accounts for these cases by applying
multiple testing correction in dependence on the degree of differential
expression:
the correction method from Benjamini and Hochberg (BH) is applied if it renders >= 1% and <= 25% of all measured genes as DE,
the p-values are left unadjusted, if the BH correction results in < 1% DE genes, and
the more stringent Bonferroni correction is applied, if the BH correction results in > 25% DE genes.
Note that resulting p-values should not be used for assessing the statistical significance of DE genes within or between datasets. They are solely used to determine which genes are included in the analysis with ORA - where the flexible correction ensures that the fraction of included genes is roughly in the same order of magnitude across datasets.
Alternative stratgies could also be applied - such as taking a constant number of genes for each dataset or excluding ORA methods in general from the assessment.
Examples
# reading user-defined expression data from file
data.dir <- system.file("extdata/myEData", package="GSEABenchmarkeR")
edat <- loadEData(data.dir)
# differential expression analysis
edat <- runDE(edat)
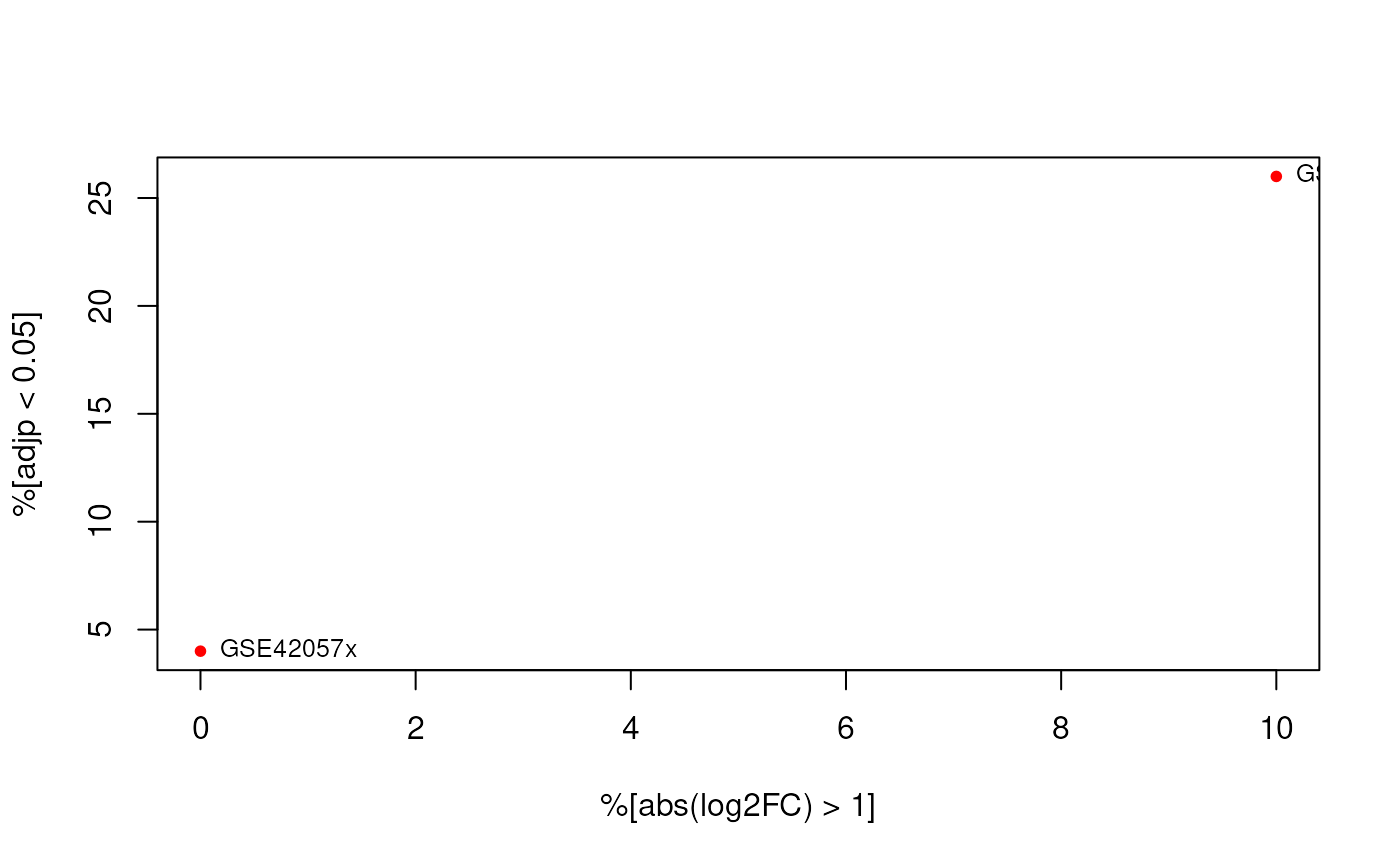
# visualization of per-dataset DE distribution
plotDEDistribution(edat)
 # calculating meta fold changes across datasets
mfcs <- metaFC(edat, max.na=0)
# writing DE results to file
out.dir <- tempdir()
out.dir <- file.path(out.dir, "de")
if(!file.exists(out.dir)) dir.create(out.dir)
writeDE(edat, out.dir)
# calculating meta fold changes across datasets
mfcs <- metaFC(edat, max.na=0)
# writing DE results to file
out.dir <- tempdir()
out.dir <- file.path(out.dir, "de")
if(!file.exists(out.dir)) dir.create(out.dir)
writeDE(edat, out.dir)