Calculate distance between two vectors, rows of one matrix/dataframe, or rows of two matrices/dataframes.
Source:R/phenoDist.R
phenoDist.RdThis function does some simple looping to allow x and y to be various combinations of vectors and matrices/dataframes.
Arguments
- x
A vector, matrix or dataframe
- y
NULL, a vector, matrix, or dataframe. If x is a vector, y must also be specified.
- bins
discretize continuous fields in the specified number of bins
- vectorDistFun
A function of two vectors that returns the distance between those vectors.
- ...
Extra arguments passed on to vectorDistFun
Value
a matrix of distances between pairs of rows of x (if y is unspecified), or between all pairs of rows between x and y (if both are provided).
Examples
example("phenoFinder")
#>
#> phnFnd> library(curatedOvarianData)
#>
#> phnFnd> data(GSE32063_eset)
#>
#> phnFnd> data(GSE17260_eset)
#>
#> phnFnd> esets2 <- list(JapaneseB=GSE32063_eset,
#> phnFnd+ Yoshihara2010=GSE17260_eset)
#>
#> phnFnd> ## standardize the sample ids to improve matching based on clinical annotation
#> phnFnd> esets2 <- lapply(esets2, function(X){
#> phnFnd+ X$alt_sample_name <- paste(X$sample_type, gsub("[^0-9]", "", X$alt_sample_name), sep="_")
#> phnFnd+
#> phnFnd+ ## Removal of columns that cannot possibly match also helps duplicated patients to stand out
#> phnFnd+ pData(X) <- pData(X)[, !grepl("uncurated_author_metadata", colnames(pData(X)))]
#> phnFnd+ X <- X[, 1:20] ##speed computations
#> phnFnd+ return(X) })
#>
#> phnFnd> ## See first six samples in both rows and columns
#> phnFnd> phenoFinder(esets2)[1:6, 1:6]
#> GSM432220 GSM432221 GSM432222 GSM432223 GSM432224 GSM432225
#> GSM795125 0.2351904 0.1014047 0.3525417 0.7274151 0.2189890 0.27397077
#> GSM795126 0.5404524 0.2588727 0.4083015 0.4079720 0.2927870 0.74123368
#> GSM795127 0.3791279 0.5008562 0.4983502 0.4981226 0.6385506 0.04416984
#> GSM795128 0.2351904 0.1014047 0.3525417 0.3523760 0.2189890 0.27397077
#> GSM795129 0.1076309 0.2395470 0.2190910 0.2189890 0.3643260 0.16030839
#> GSM795130 0.2603947 0.1344290 0.1077761 0.1076793 0.2489234 0.29544860
pdat1 <- pData(esets2[[1]])
pdat2 <- pData(esets2[[2]])
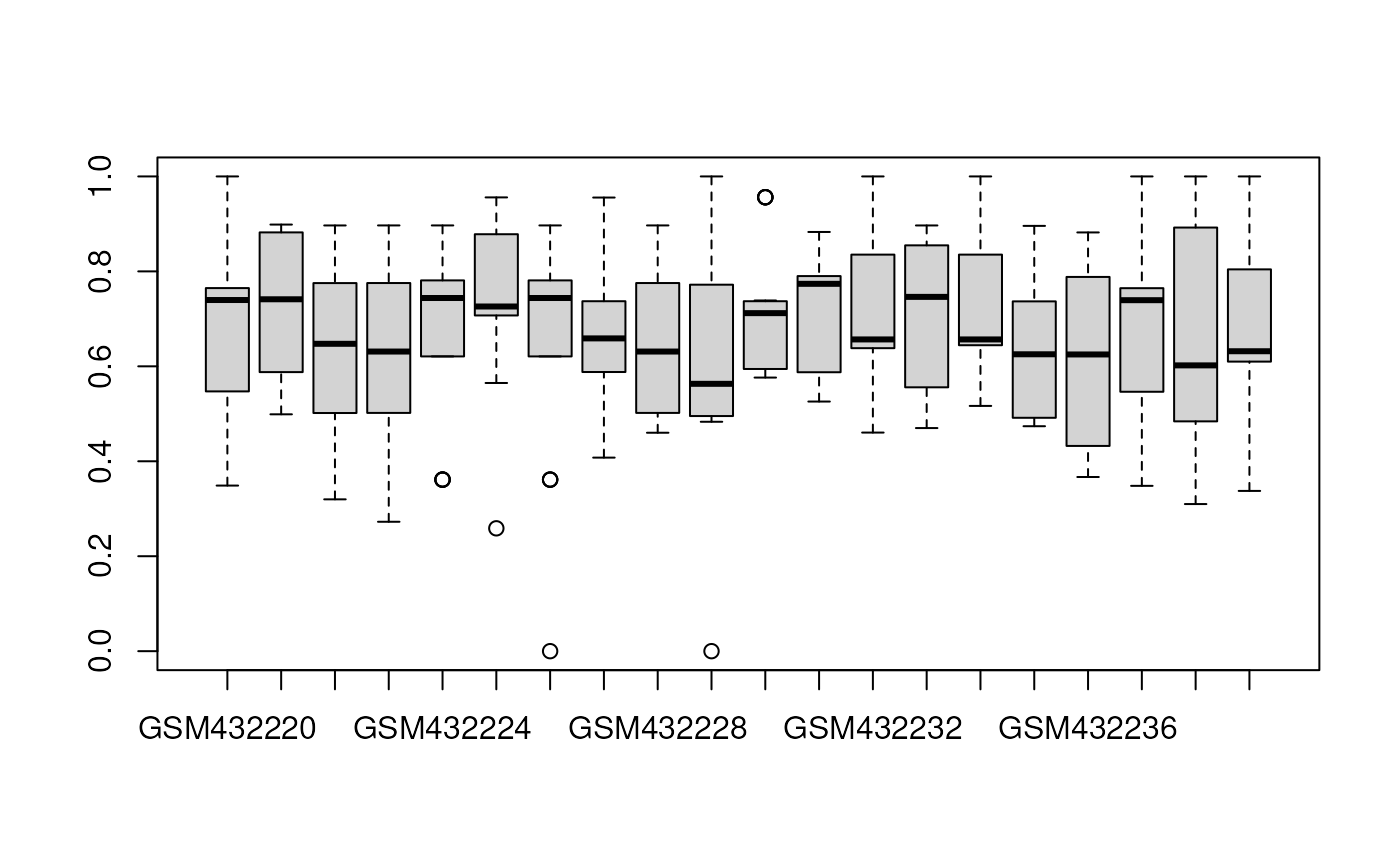
## Use phenoDist() to calculate a weighted distance matrix
distmat <- phenoDist(as.matrix(pdat1), as.matrix(pdat2))
## Note outliers with identical clinical data, these are probably the same patients:
graphics::boxplot(distmat)
 if (FALSE) { # \dontrun{
library(curatedOvarianData)
data(GSE32063_eset)
data(GSE17260_eset)
pdat1 <- pData(GSE32063_eset)
pdat2 <- pData(GSE17260_eset)
## Curation of the alternative sample identifiers makes duplicates stand out more:
pdat1$alt_sample_name <-
paste(pdat1$sample_type,
gsub("[^0-9]", "", pdat1$alt_sample_name),
sep = "_")
pdat2$alt_sample_name <-
paste(pdat2$sample_type,
gsub("[^0-9]", "", pdat2$alt_sample_name),
sep = "_")
## Removal of columns that cannot possibly match also helps duplicated patients to stand out
pdat1 <-
pdat1[,!grepl("uncurated_author_metadata", colnames(pdat1))]
pdat2 <-
pdat2[,!grepl("uncurated_author_metadata", colnames(pdat2))]
## Use phenoDist() to calculate a weighted distance matrix
distmat <- phenoDist(as.matrix(pdat1), as.matrix(pdat2))
## Note outliers with identical clinical data, these are probably the same patients:
graphics::boxplot(distmat)
} # }
if (FALSE) { # \dontrun{
library(curatedOvarianData)
data(GSE32063_eset)
data(GSE17260_eset)
pdat1 <- pData(GSE32063_eset)
pdat2 <- pData(GSE17260_eset)
## Curation of the alternative sample identifiers makes duplicates stand out more:
pdat1$alt_sample_name <-
paste(pdat1$sample_type,
gsub("[^0-9]", "", pdat1$alt_sample_name),
sep = "_")
pdat2$alt_sample_name <-
paste(pdat2$sample_type,
gsub("[^0-9]", "", pdat2$alt_sample_name),
sep = "_")
## Removal of columns that cannot possibly match also helps duplicated patients to stand out
pdat1 <-
pdat1[,!grepl("uncurated_author_metadata", colnames(pdat1))]
pdat2 <-
pdat2[,!grepl("uncurated_author_metadata", colnames(pdat2))]
## Use phenoDist() to calculate a weighted distance matrix
distmat <- phenoDist(as.matrix(pdat1), as.matrix(pdat2))
## Note outliers with identical clinical data, these are probably the same patients:
graphics::boxplot(distmat)
} # }