This repository provides reproducible examples and tables shown in the “RaggedExperiment: the missing link between genomic ranges and matrices in Bioconductor” manuscript. Below is an example use case provided by Vincent J. Carey. See the Articles section to see other use cases and table code.
Installation
if (!requireNamespace("RaggedExperiment", quietly = TRUE))
    install.packages("BiocManager")

BiocManager::install("RaggedExperiment")Enumerate mutations by symbol in BRCA, couple to overall survival
suppressMessages({
  bmut <- curatedTCGAData("BRCA", "Mutation", dry.run=FALSE, version="2.0.1")
})
sampleTables(bmut)
#> $`BRCA_Mutation-20160128`
#>
#>  01  06
#> 988   5
Filter only for primary solid tumors (code 01)
bmut.srv <- TCGAprimaryTumors(bmut)
#> harmonizing input:
#>   removing 5 sampleMap rows with 'colname' not in colnames of experiments
sampleTables(bmut.srv)
#> $`BRCA_Mutation-20160128`
#>
#>  01
#> 988Check for replicates
anyReplicated(bmut.srv)
#> BRCA_Mutation-20160128
#>                   TRUE

## Obtain names of replicate samples by colData rowname
replicates <- Filter(length,
    lapply(
      replicated(bmut.srv)[["BRCA_Mutation-20160128"]],
      function(x) {
        colnames(rgmut)[x]
      }
    )
)
Total number of patients with replicates
sum(sapply(replicated(bmut.srv), any))
#> [1] 9
## OR
length(replicates)
#> [1] 9See mutation classifications
ragex <- bmut.surv[["BRCA_Mutation-20160128"]]
table(mcols(ragex)$Variant_Classification)
#>
#>   Frame_Shift_Del   Frame_Shift_Ins      In_Frame_Del      In_Frame_Ins Missense_Mutation Nonsense_Mutation  Nonstop_Mutation               RNA            Silent
#>              3162              2567               627               161             55063              4841               133              4474             17901
#>       Splice_Site
#>              1561
Select only non-silent mutations
## mcolsFilter (?)
ragex <- ragex[mcols(ragex)$Variant_Classification != "Silent",  ]
table(mcols(ragex)$Variant_Classification)
#>
#>   Frame_Shift_Del   Frame_Shift_Ins      In_Frame_Del      In_Frame_Ins Missense_Mutation Nonsense_Mutation  Nonstop_Mutation               RNA       Splice_Site
#>              3162              2567               627               161             55063              4841               133              4474              1561
bmut[["BRCA_Mutation-20160128"]] <- ragex
#> harmonizing input:
#> removing 16 sampleMap rows with 'colname' not in colnames of experimentsObtain Hugo_Symbols for each sample
system.time({
    mutsyms <- as(
        lapply(
          as(bmut.surv[["BRCA_Mutation-20160128"]], "GRangesList"),
          function(x) x$Hugo_Symbol
        ),
        "CharacterList"
    )
})
#>    user  system elapsed
#>   3.349   0.000   3.349
mutsyms
#> CharacterList of length 793
#> [["TCGA-A1-A0SB-01A-11D-A142-09"]] ABLIM1 ADAMTS20 CADM2 DTNB ENSG00000267261 MSH3 MYB NPIPL2 OR11H1 OTOR P2RY10 PIEZO1 SLC6A9 SOX15 SPTB TMEM247 ZNF566 ZNF574 ZNF777
#> [["TCGA-A1-A0SD-01A-11D-A10Y-09"]] ANK3 CASK CNTFR CPEB2 CSTL1 CXorf58 DCAF8 FAM182B GATA3 HECTD4 ... SLC44A3 SLFN14 SNX5 STK11IP SYNE1 TLR5 WDR72 ZFP91 ZNF544 ZNF740
#> [["TCGA-A1-A0SE-01A-11D-A099-09"]] APLF ARRDC4 B3GNT1 C3orf38 CDH1 DCDC2B FAM102A FAM102A FHL1 IMPDH2 ... SDR16C5 SYDE2 TBC1D12 TBL1X UNC13C WDR86 WDR91 ZFHX4 ZNF541
#> [["TCGA-A1-A0SF-01A-11D-A142-09"]] ACRBP ARL6IP6 BEST3 C9orf43 CECR2 CUL7 DDX53 DUSP27 EPPK1 EXT2 FIGN ... PTPRD RIT2 SFMBT2 SKOR1 SPPL2C ST7 TP73 TPH1 UBE2QL1 ZNF91
#> [["TCGA-A1-A0SG-01A-11D-A142-09"]] ARC BPIFB3 C2orf73 CECR2 CEP290 CSMD2 DSCAM DYSF ERN1 EWSR1 ... PADI2 PPID RNA5-8SP6 SCN7A SLC29A2 SYNPO2L TMEM99 TYSND1 ZNF217
#> [["TCGA-A1-A0SH-01A-11D-A099-09"]] ACSL4 AHCTF1 ALPK3 ANK3 ANKRD7 APOBR ARHGAP28 ASL ATPIF1 BDP1 ... TIFAB TMC8 TTC39A UNC93B1 UPRT USH2A WDR7 WDR87 ZFHX4 ZNF606
#> [["TCGA-A1-A0SI-01A-11D-A142-09"]] ABAT ABCA8 ACAN ACPP ACTR3B ADCK3 AGFG2 AHNAK AKR1C1 AKT2 ... ZNF345 ZNF366 ZNF419 ZNF436 ZNF436 ZNF518A ZNF673 ZNF701 ZNF790
#> [["TCGA-A1-A0SJ-01A-11D-A099-09"]] ALG1 AMZ2 ASCL3 CHML CILP COL20A1 ENSG00000235041 FAF2 FAM115C GJB2 ... RANBP6 SCN4A SNAI1 SPEN TH1L TRBV6-8 UBAP1L ZBTB11 ZNF543
#> [["TCGA-A1-A0SK-01A-12D-A099-09"]] ABCA11P ACBD5 AHNAK ALMS1P ANKRD36B ANKRD42 ARHGAP42 ARL11 ASB10 ... YIPF7 YTHDF2 ZNF234 ZNF417 ZNF469 ZNF469 ZNF66P ZNF717 ZNF777
#> [["TCGA-A1-A0SM-01A-11D-A099-09"]] AHDC1 ATP1A4 CLEC12A CP CSMD1 DCST1 EGR3 ESYT1 GOLGA3 HEATR4 ... SEZ6L2 SMARCA1 STEAP2 TBC1D8 TCTE1 TSNARE1 ZAN ZNF229 ZNF804B
#> ...
#> <783 more elements>
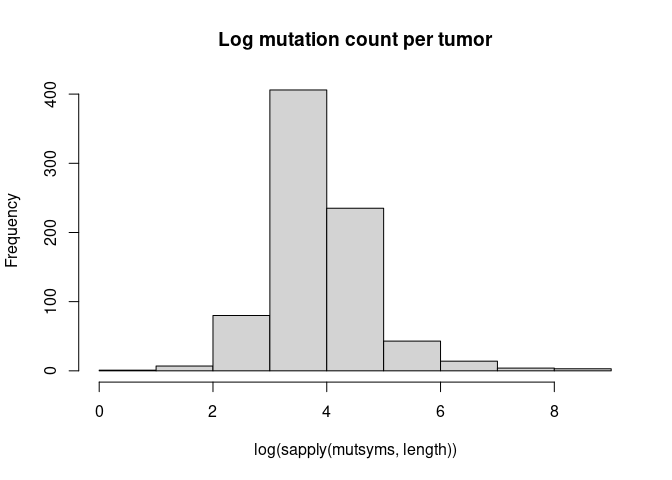
Sample mutations tally
system.time({
  print(table(sapply(mutsyms, function(x) sum(duplicated(x)))))
})
#>
#>    0    1    2    3    4    5    6    7    8    9   10   11   12   14   15   16   17   20   21   22   23   24   25   26   27   28   29   30   31   32   33   37   39
#>  354  184   80   45   24   18    7    5    6    1    2    1    4    1    1    2    2    2    2    2    1    2    2    1    1    2    2    2    1    2    3    1    1
#>   48   49   51   52   57   64   66   70   72   73   79   83   90   91   95   96  102  104  136  166  170  221  264  726 1009 1469
#>    1    1    2    1    2    1    1    1    1    1    1    1    1    1    1    1    2    1    1    1    1    1    1    1    1    1
#>    user  system elapsed
#> 0.030 0.062 0.092Compare to GDC Data Portal plot
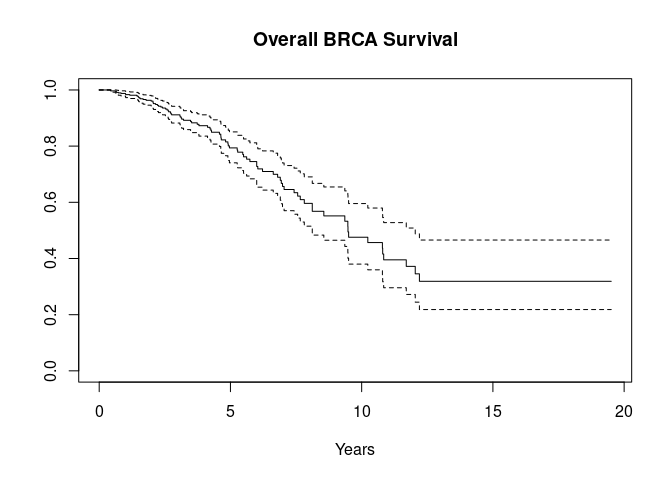
The display, based on 793 observations with non-missing TCGA OS.Time, is consistent with the display at the GDC Data Portal, based on 1077 cases.
Obtain gene-stratified survival
gstrat <- function(sym="TTN", mutlist, survdat) {
  stopifnot(inherits(survdat, "Surv"))
  stopifnot(length(survdat) == length(mutlist))
  hassym <- unlist(list(sym) %in% mutlist)
  plot(survfit(survdat~hassym), main=sym, lty=1:2, xlab="Years")
}

gstrat("TTN", mutsyms, osurv)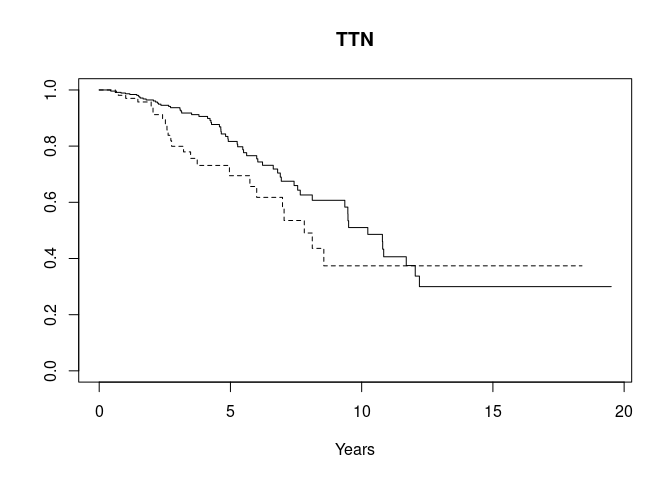
gstrat("TP53", mutsyms, osurv)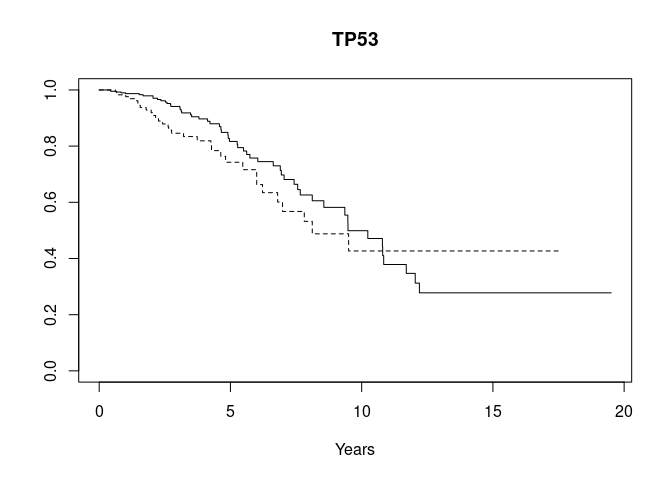
Frequencies
commut <- head(sort(table(unlist(mutsyms)), decreasing = TRUE), 30)
commut
#>
#>  PIK3CA     TTN    TP53   MUC16   GATA3  MAP3K1   MUC12    MLL3    MUC4   SYNE1    CDH1    RYR2 CROCCP2     DST     FLG     DMD    SPEN   FCGBP   USH2A   HMCN1
#>     312     300     272     134      97      91      78      75      69      65      64      62      58      58      56      52      52      51      51      50
#>    RYR3   SYNE2   AHNAK   MUC5B     NEB   OBSCN  AHNAK2    APOB   XIRP2    HRNR
#> 50 50 48 48 47 47 46 45 45 43Combinations of mutations
hasmut <- function(sym="TP53", mutlist) {
    sapply(mutlist, function(x) sym %in% x)
}
table(hasmut("TP53", mutsyms), hasmut("PIK3CA", mutsyms))
#>
#>         FALSE TRUE
#>   FALSE   341  198
#> TRUE 192 62Greedy search for deleterious pairs
indicate_pair <- function(sym1, sym2, mutlist)
  hasmut(sym1, mutlist) & hasmut(sym2, mutlist)
chk <- apply(common_pairs,2,function(z) indicate_pair(z[1], z[2], mutsyms))
chkp.inds <- which(apply(chk,2,sum)>20) # disallow very rare combos
dim(chk)
#> [1] 793 435
dim(chk[,chkp.inds])
#> [1] 793  15
chisqs <- apply(chk[,chkp.inds],2,function(z)survdiff(osurv~z)$chisq)
hist(chisqs)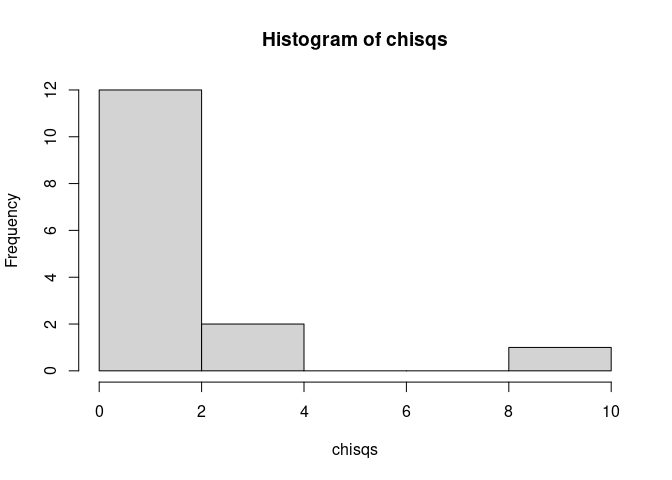
cpr <- common_pairs[,chkp.inds][, which(chisqs>5)]
plot(survfit(osurv~chk[,chkp.inds[which(chisqs>5)]]), lty=1:2, main=paste(cpr, collapse=" & " ))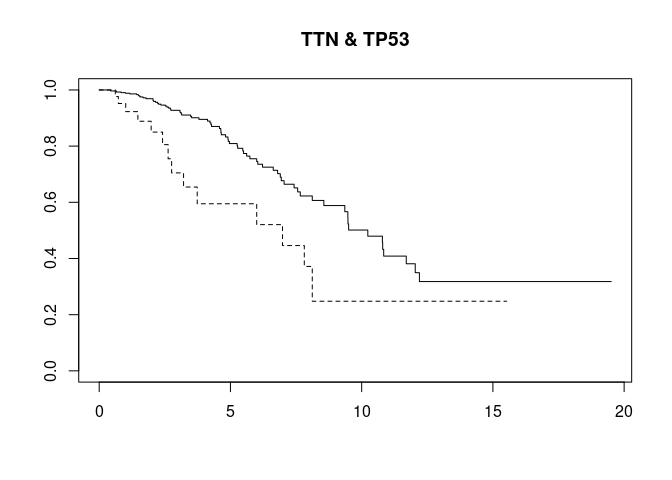
Using domain classification of mutations
dom <- assay(bmut.surv[[1L]], "domain_WU")
length(grep("Znf", na.omit(as.character(dom)))) # frequently noted
#> [1] 1857
register(MulticoreParam(parallel::detectCores() - 1L))
system.time(
    mutdoms <- bplapply(
        seq_len(ncol(dom)),
        function(x) as.character(na.omit(dom[,x]))
    )
)
#>    user  system elapsed
#>   0.172   2.421   3.241
Isolate individuals with mutations
Znf domain
noz <- sapply(mutdoms, function(x) length(grep("Znf", x))==0)
table(noz)
#> noz
#> FALSE  TRUE
#>   520   273
survdiff(osurv~noz)
#> Call:
#> survdiff(formula = osurv ~ noz)
#>
#>             N Observed Expected (O-E)^2/E (O-E)^2/V
#> noz=FALSE 520       51     50.1    0.0168    0.0395
#> noz=TRUE  273       37     37.9    0.0221    0.0395
#>
#>  Chisq= 0  on 1 degrees of freedom, p= 0.8
SH3
nosh3 <- sapply(mutdoms, function(x) length(grep("SH3", x))==0)
survdiff(osurv~nosh3)
#> Call:
#> survdiff(formula = osurv ~ nosh3)
#>
#>               N Observed Expected (O-E)^2/E (O-E)^2/V
#> nosh3=FALSE 109        8     8.32   0.01215    0.0136
#> nosh3=TRUE  684       80    79.68   0.00127    0.0136
#>
#>  Chisq= 0  on 1 degrees of freedom, p= 0.9