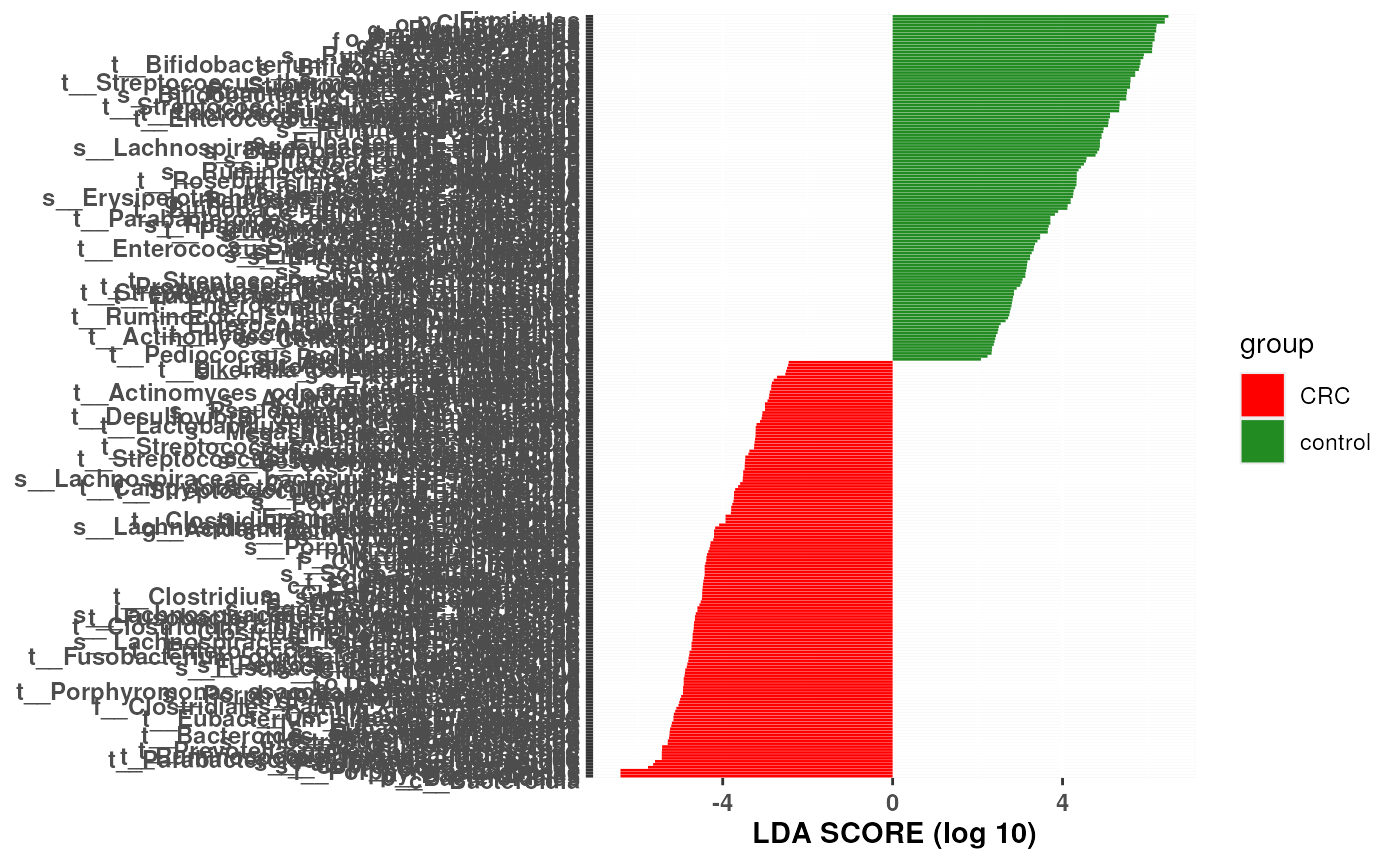
This function plots the biomarkers found by LEfSe, that are ranked according to their effect sizes and linked to their abundance in each class.
lefserPlot(
  df,
  colors = c("c", "l", "g"),
  trim.names = TRUE,
  title = "",
  label.font.size = 3
)
Arguments
- df
Data frame produced by
lefser. This data frame contains two columns labeled asc("features", "scores").- colors
Colors corresponding to class 0 and 1. Options: "c" (colorblind), "l" (lefse), "g" (greyscale). Defaults to "c". This argument also accepts a character(2) with two color names.
- trim.names
Under the default (
TRUE), this function extracts the most specific taxonomic rank of organism.- title
A character(1). The title of the plot.
- label.font.size
A numeric(1). The font size of the feature labels. The default is
3.
Value
Function returns plot of effect size scores produced by lefser.
Positive scores represent the biomarker is more abundant in class '1'.
Negative scores represent the biomarker is more abundant in class '0'.
Examples
example("lefser")
#>
#> lefser>     data(zeller14)
#>
#> lefser>     zeller14 <- zeller14[, zeller14$study_condition != "adenoma"]
#>
#> lefser>     tn <- get_terminal_nodes(rownames(zeller14))
#>
#> lefser>     zeller14tn <- zeller14[tn,]
#>
#> lefser>     zeller14tn_ra <- relativeAb(zeller14tn)
#>
#> lefser>     # (1) Using classes only
#> lefser>     res_class <- lefser(zeller14tn_ra,
#> lefser+                         classCol = "study_condition")
#> The outcome variable is specified as 'study_condition' and the reference category is 'CRC'.
#>  See `?factor` or `?relevel` to change the reference category.
#>
#> lefser>     # (2) Using classes and sub-classes
#> lefser>     res_subclass <- lefser(zeller14tn_ra,
#> lefser+                         classCol = "study_condition",
#> lefser+                         subclassCol = "age_category")
#> The outcome variable is specified as 'study_condition' and the reference category is 'CRC'.
#>  See `?factor` or `?relevel` to change the reference category.
lefserPlot(res_class)
#> Warning: Ignoring unknown parameters: `size`