NYC-HANES2 Social Epidemiology of the Oral Microbiome
Audrey Renson
social-epi.RmdDescriptives
Table 1: Demographics & Descriptive Statistics
| Full NYC HANES Sample | Oral Microbiome Subsample | SMD | |
|---|---|---|---|
| Total | 1527 | 282 | |
| Age in years – median [range] | 42 [20 to 94] | 42 [20 to 97] | 0.066 |
| Age group (%) | 0.083 | ||
| 20-29 | 360 (23.6) | 70 (24.8) | |
| 30-39 | 337 (22.1) | 60 (21.3) | |
| 40-49 | 252 (16.5) | 51 (18.1) | |
| 50-59 | 264 (17.3) | 51 (18.1) | |
| 60 and over | 314 (20.6) | 50 (17.7) | |
| Sex = Female (%) | 885 (58.0) | 150 (53.2) | 0.096 |
| Educational achievement (%) | 0.240 | ||
| College graduate or more | 628 (41.1) | 87 (30.9) | |
| Less than High school diploma | 316 (20.7) | 65 (23.0) | |
| High school graduate/GED | 244 (16.0) | 63 (22.3) | |
| Some College or associate’s degree | 337 (22.1) | 67 (23.8) | |
| Missing | 2 ( 0.1) | 0 ( 0.0) | |
| Annual family income (%) | 0.065 | ||
| $60,000 or more | 429 (28.1) | 82 (29.1) | |
| Less Than $30,000 | 537 (35.2) | 105 (37.2) | |
| $30,000 - $60,000 | 348 (22.8) | 59 (20.9) | |
| Missing | 213 (13.9) | 36 (12.8) | |
| Marital Status (%) | 0.152 | ||
| Married | 590 (38.6) | 96 (34.0) | |
| Widowed | 76 ( 5.0) | 15 ( 5.3) | |
| Divorced | 156 (10.2) | 23 ( 8.2) | |
| Separated | 51 ( 3.3) | 12 ( 4.3) | |
| Never married | 511 (33.5) | 101 (35.8) | |
| Living with partner | 143 ( 9.4) | 35 (12.4) | |
| Race/ethnicity (%) | 0.196 | ||
| Non-Hispanic White | 513 (33.6) | 97 (34.4) | |
| Non-Hispanic Black | 340 (22.3) | 75 (26.6) | |
| Hispanic | 390 (25.5) | 71 (25.2) | |
| Asian | 204 (13.4) | 22 ( 7.8) | |
| Other | 80 ( 5.2) | 17 ( 6.0) | |
| Place of birth (%) | 0.246 | ||
| US, PR and Territories | 668 (43.7) | 90 (31.9) | |
| Other | 851 (55.7) | 190 (67.4) | |
| Missing | 8 ( 0.5) | 2 ( 0.7) | |
| Gum disease (self-reported) (%) | 0.165 | ||
| Yes | 175 (11.5) | 27 ( 9.6) | |
| No | 1322 (86.6) | 254 (90.1) | |
| Missing | 30 ( 2.0) | 1 ( 0.4) | |
| Mouthwash use (times per week) (%) | 0.058 | ||
| None | 591 (38.7) | 115 (40.8) | |
| 1 to 5 | 370 (24.2) | 68 (24.1) | |
| 6 to 7 | 565 (37.0) | 99 (35.1) | |
| Missing | 1 ( 0.1) | 0 ( 0.0) | |
| Sugar-sweetened beverages (per week) (%) | 0.233 | ||
| 0-<1 | 985 (64.5) | 152 (53.9) | |
| 1-5 | 313 (20.5) | 67 (23.8) | |
| 6 or more | 227 (14.9) | 62 (22.0) | |
| Missing | 2 ( 0.1) | 1 ( 0.4) | |
| Smoking status (%) | 1.058 | ||
| Cigarette | 215 (14.1) | 86 (30.5) | |
| Never smoker | 843 (55.2) | 43 (15.2) | |
| Former smoker | 285 (18.7) | 43 (15.2) | |
| Alternative smoker | 142 ( 9.3) | 72 (25.5) | |
| Secondhand | 42 ( 2.8) | 38 (13.5) |
Checking collinearity using Cramer’s V
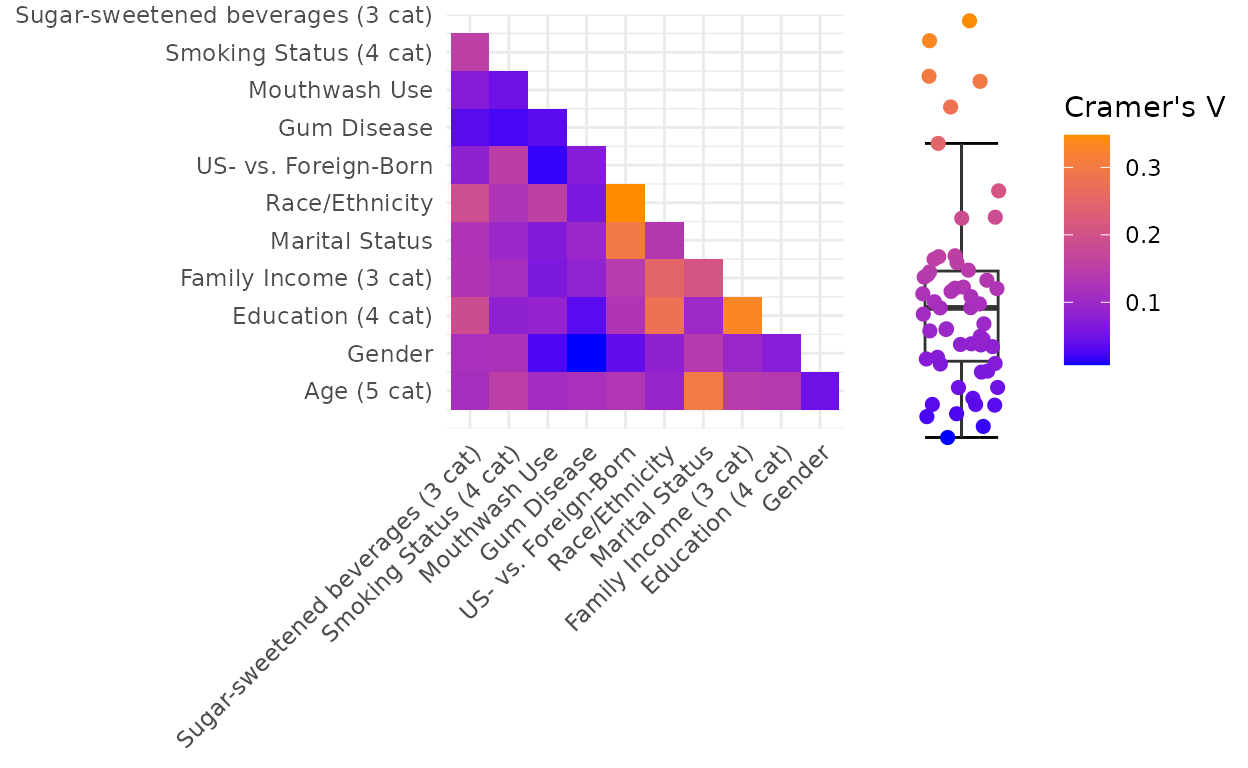
Examining collinearity among sociodemographic variables. Data are absolute value of pairwise Cramer’s V correlation coefficient between sociodemographic factor levels. Data are from the full sample (n=1,527) of the New York City Health and Nutrition Examination Survey, 2013-2014. Abbreviations: cat=categories; US=United States..
Abundance
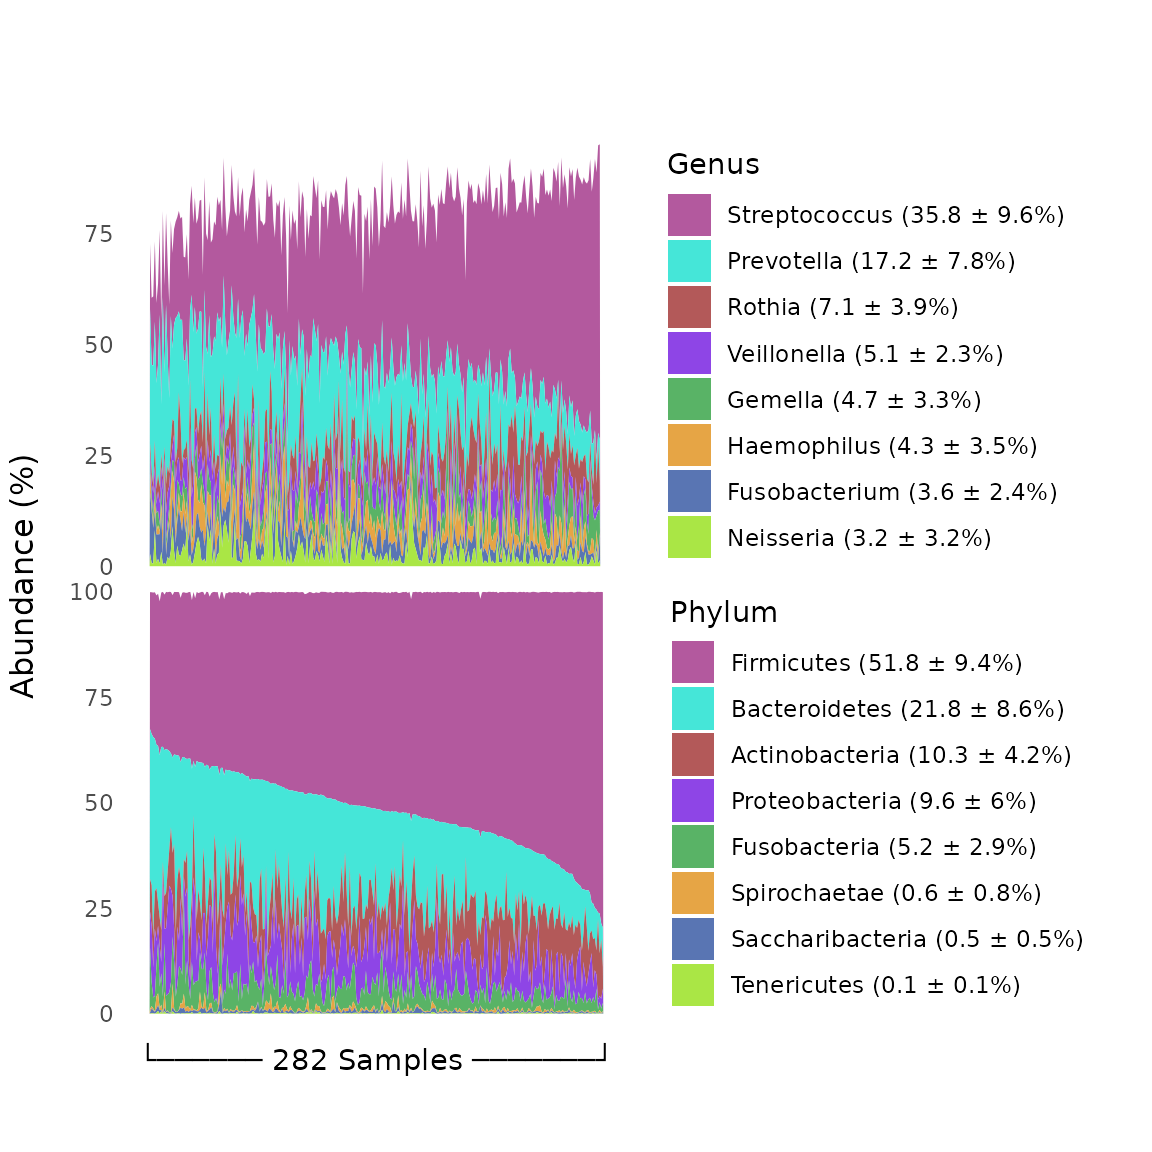
Genus- and phylum-level relative abundances. Data are percent of overall communities within samples, summarized as mean ± standard deviation of percent across samples. Data are from the oral microbiome subsample (n=296) of the New York City Health and Nutrition Examination Survey, 2013-2014.
Alpha Diversity
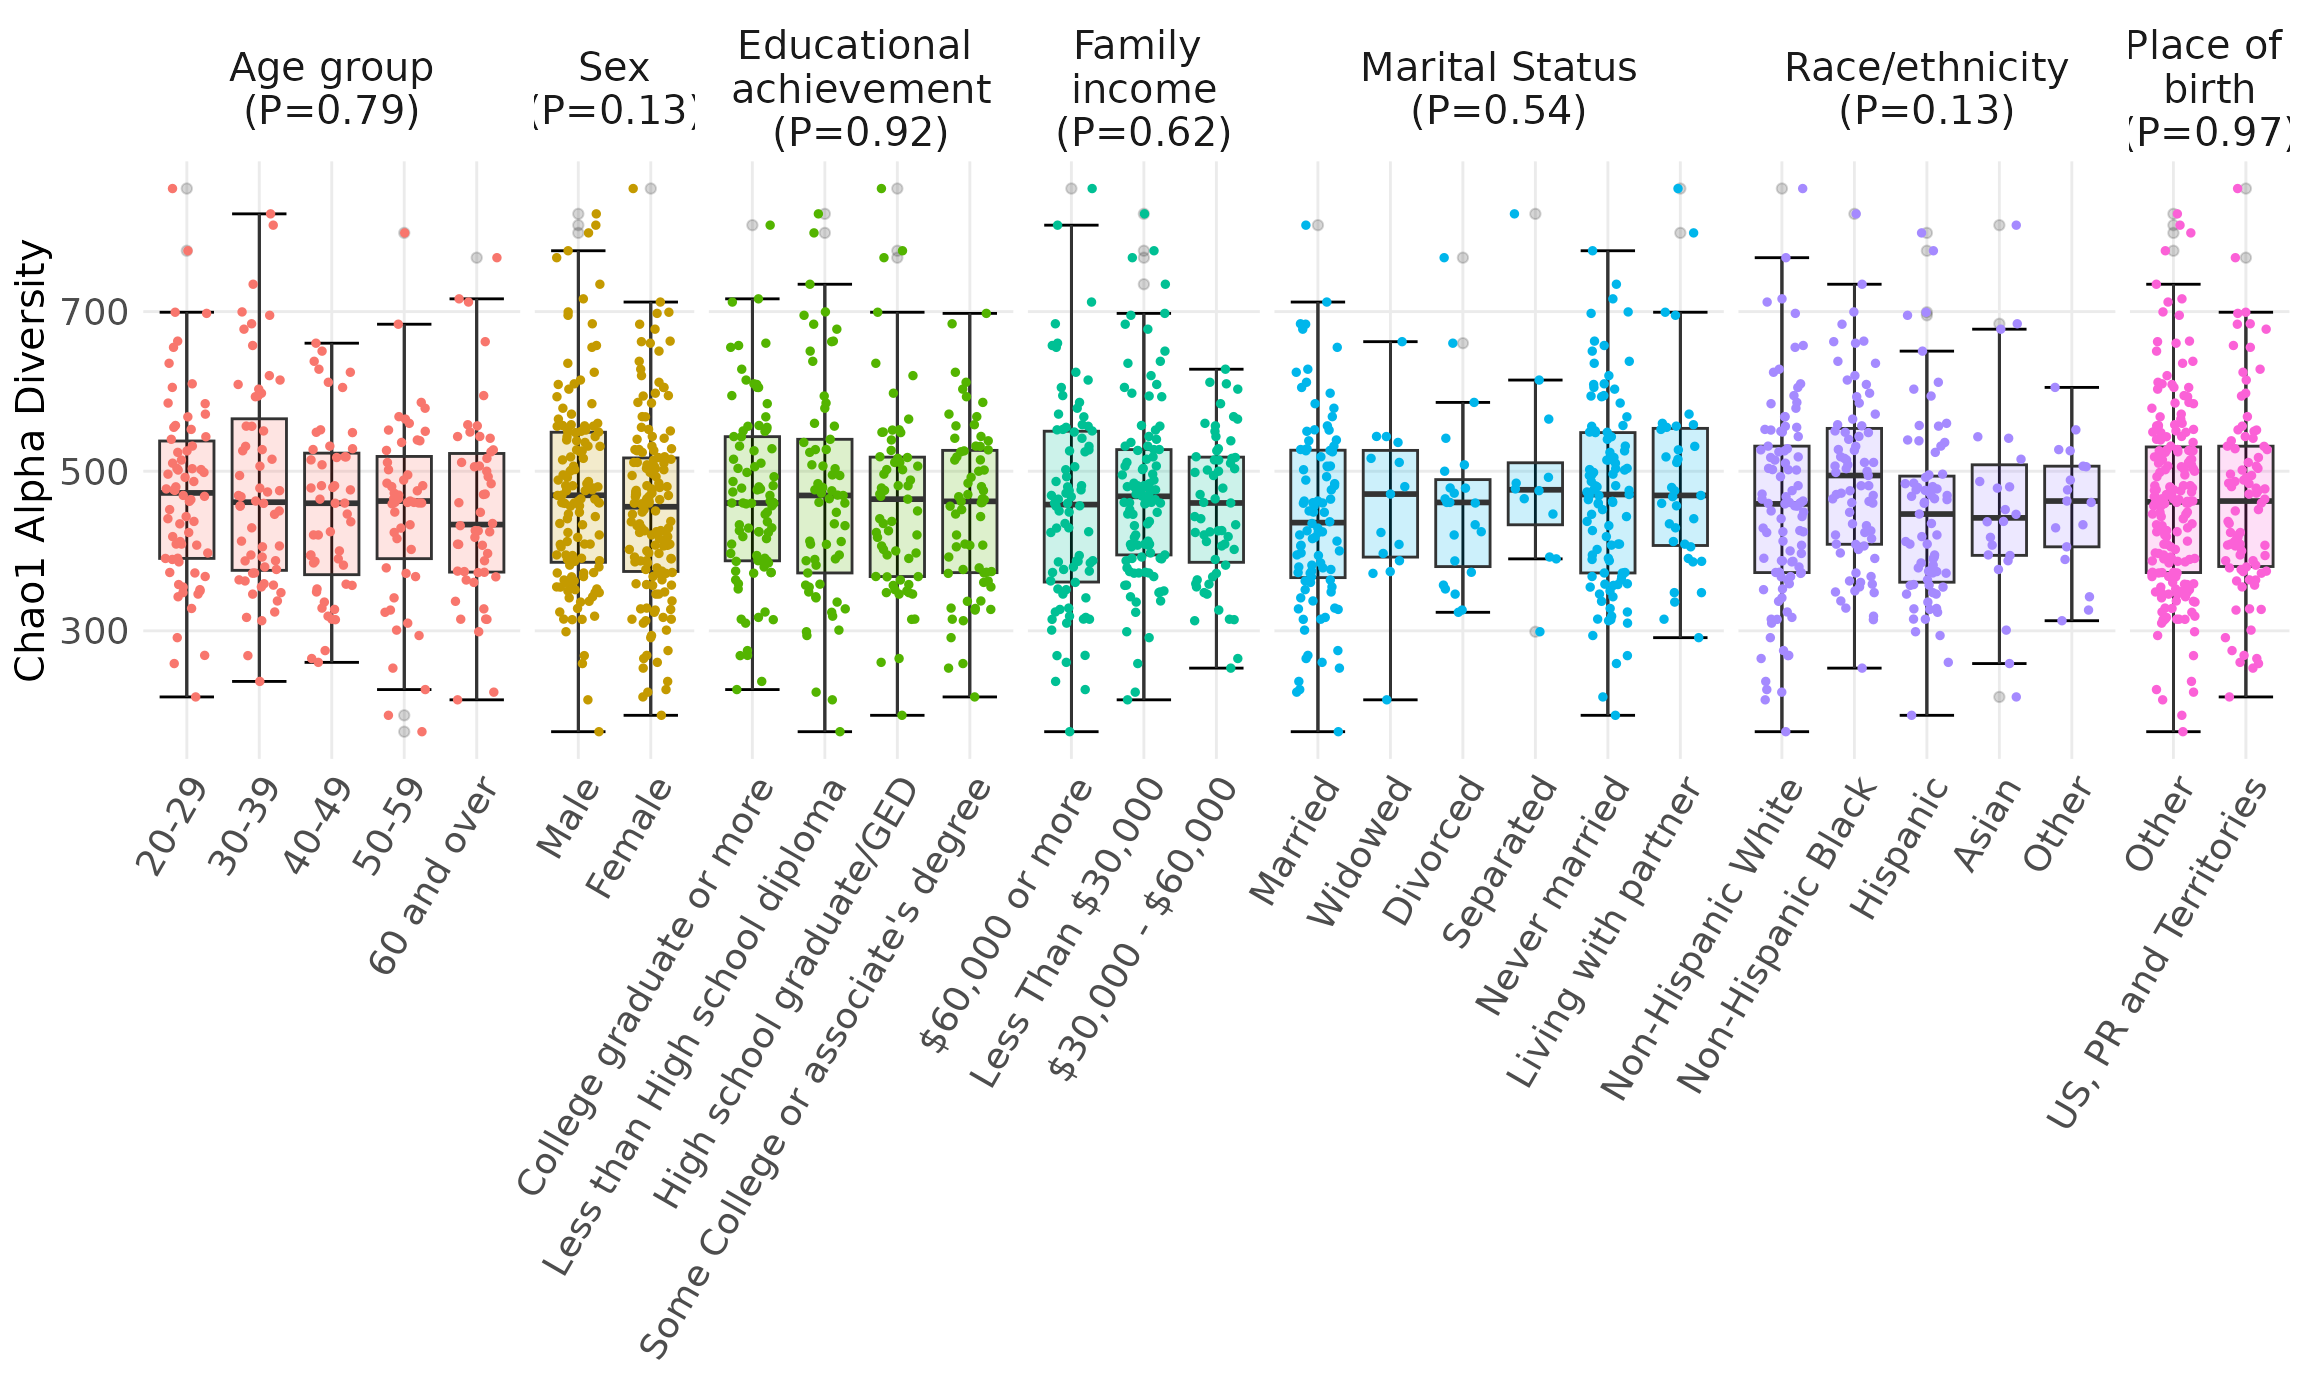
Alpha diversity by Sociodemographic Characteristics. Chao1 alpha diversity of 16S rRNA oral microbiome samples. Measures were compared using a null hypothesis of no difference between groups (Kruskal-Wallis test, p > 0.1 for all tests). Data are from the oral microbiome subsample (n=296) of the New York City Health and Nutrition Examination Survey, 2013-2014. Abbreviations: GED=General equivalency diploma; PR=Puerto Rico; US=United States.
edgeR Differential Abundance
Tileplot
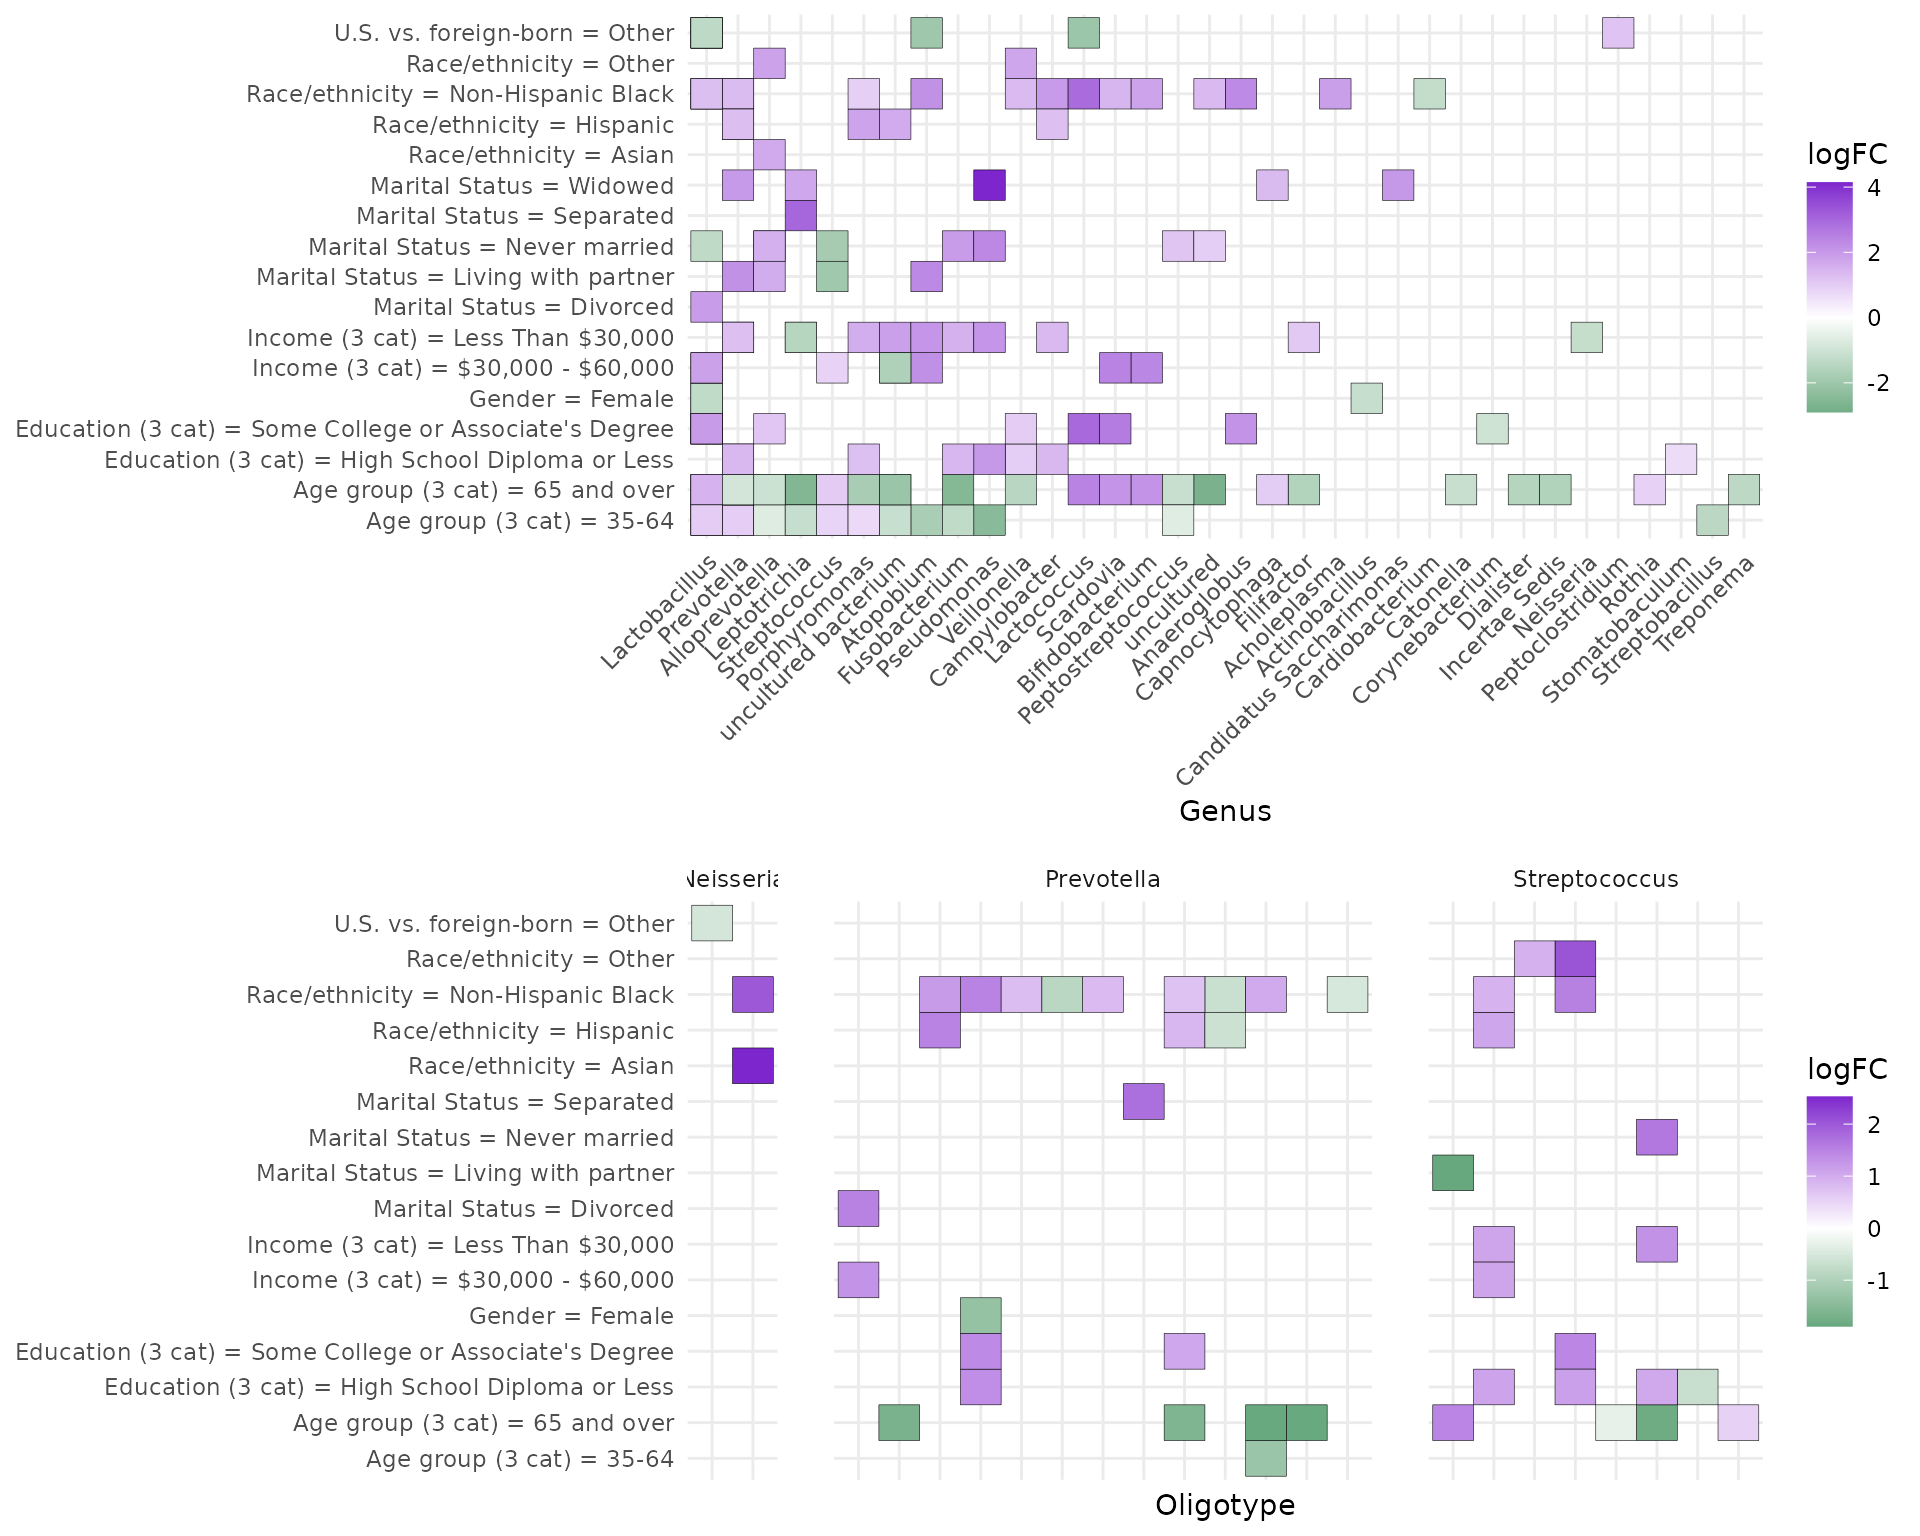
Differential abundance by sociodemographic characteristics. OTUs (A) and oligotypes (B) meeting unadjusted FDR <0.01 in negative binomial log-linear GLMs using edgeR. Filled tiles in (A) indicate the genus had at least one OTU differentially abundant by at least one coefficient contrast within the sociodemographic factor. Most commonly differential genera in (A) included Prevotella (n=8) and Lactobacillus (n=7).
Boxplots of crude vs. adjusted
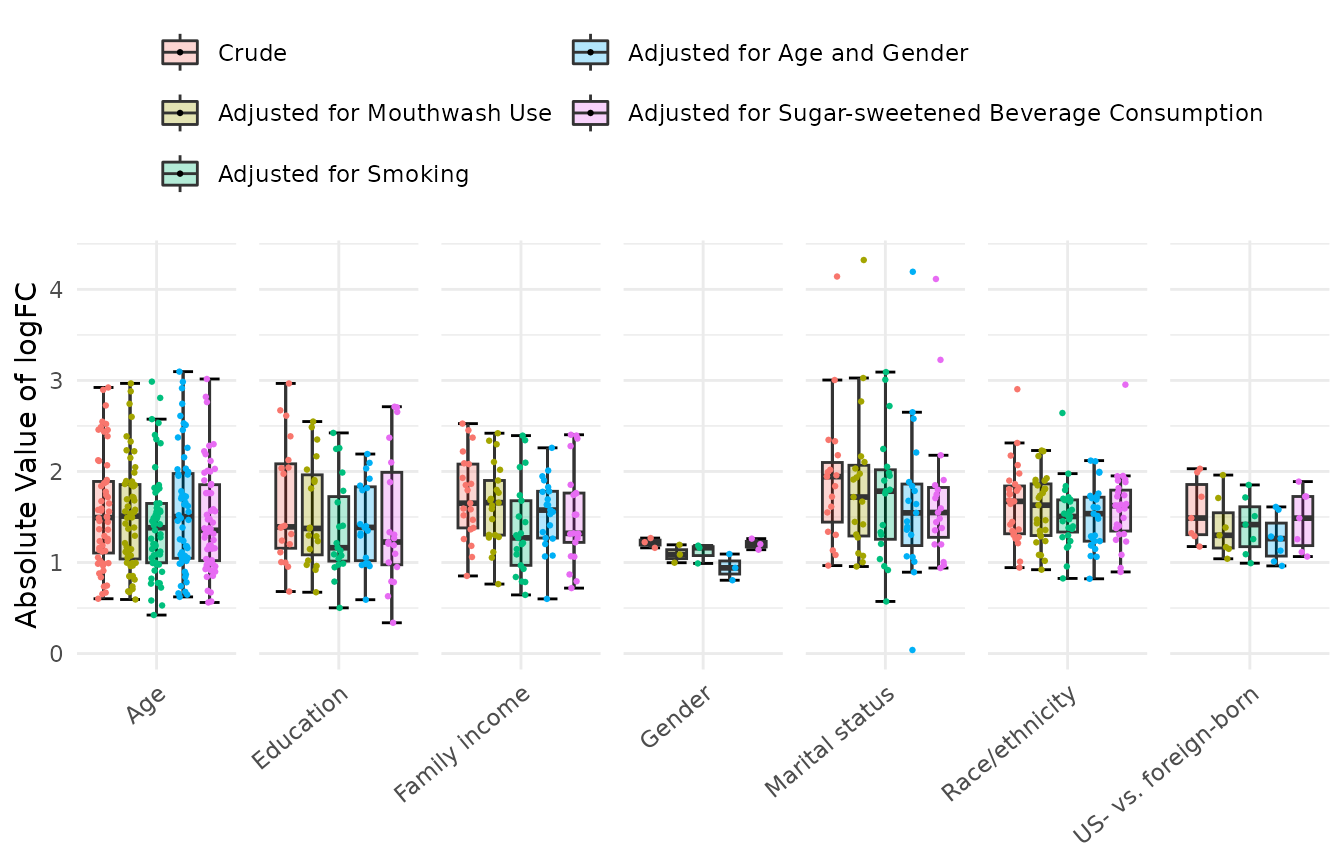
Distribution of absolute values of log-fold change (logFC). Values are from crude and adjusted edgeR models for all OTUs meeting FDR<0.01 in the crude model, for each sociodemographic variable.
Table 2. Differential abundance findings for OTUs selected based on clinical relevance. Greater or lower abundance indicates false discovery rate (FDR) <0.01.
| Genus | Greater abundance in: | Lower abundance in: |
|---|---|---|
| Lactobacillus | Age group (3 cat) = 65 and over<br> Age group (3 cat) = 35-64<br> Education (3 cat) = Some College or Associate’s Degree<br> Income (3 cat) = $30,000 - $60,000<br> Marital Status = Divorced<br> Race/ethnicity = Non-Hispanic Black | Gender = Female<br> Marital Status = Never married<br> U.S. vs. foreign-born = Other |
| Prevotella | Age group (3 cat) = 35-64<br> Education (3 cat) = High School Diploma or Less<br> Income (3 cat) = Less Than $30,000<br> Marital Status = Living with partner<br> Marital Status = Widowed<br> Race/ethnicity = Non-Hispanic Black<br> Race/ethnicity = Hispanic | Age group (3 cat) = 65 and over |
| Streptococcus | Age group (3 cat) = 65 and over<br> Age group (3 cat) = 35-64<br> Income (3 cat) = $30,000 - $60,000 | Marital Status = Never married<br> Marital Status = Living with partner |
| Porphyromonas | Age group (3 cat) = 35-64<br> Education (3 cat) = High School Diploma or Less<br> Income (3 cat) = Less Than $30,000<br> Race/ethnicity = Hispanic<br> Race/ethnicity = Non-Hispanic Black | Age group (3 cat) = 35-64<br> Age group (3 cat) = 65 and over |
| Fusobacterium | Education (3 cat) = High School Diploma or Less<br> Income (3 cat) = Less Than $30,000<br> Marital Status = Never married | Age group (3 cat) = 35-64<br> Age group (3 cat) = 65 and over |
| Lactococcus | Age group (3 cat) = 65 and over<br> Education (3 cat) = Some College or Associate’s Degree<br> Race/ethnicity = Non-Hispanic Black | U.S. vs. foreign-born = Other |
[1] “Reference groups for sociodemographic variables are as follows: Gender: Male, Age: 20-34, Education: College Graduate or More, Family income: $60,000 or more, Marital status: Married, Race/ethnicity: Non-Hispanic White, US- vs. foreign-born: US-Born, 50 States, DC, PR and Territories”
PERMANOVA / Beta diversity
PERMANOVA table
| r_squared | F | p_value | |
|---|---|---|---|
| Smoking status | 0.0552271 | 3.5073281 | 0.001 |
| Age (5 cat) | 0.0287520 | 1.7761885 | 0.025 |
| Marital Status | 0.0282341 | 1.3888018 | 0.106 |
| Education (4 cat) | 0.0249484 | 2.0554661 | 0.017 |
| Race/ethnicity | 0.0161444 | 0.9845562 | 0.437 |
| Income (tertiles) | 0.0112810 | 1.3805711 | 0.204 |
| US-born | 0.0103475 | 2.5407267 | 0.027 |
| Gender | 0.0034551 | 0.8425114 | 0.516 |
Manuscript Text Elements
Abstract
Background
Variations in the oral microbiome are
potentially implicated in health inequalities, but existing studies of
the oral microbiome have minimal sociodemographic diversity. We describe
sociodemographic variation of the oral microbiome in a diverse
sample.
Methods
In a subsample (n=282) of the 2013-14
population-based New York City Health and Nutrition Examination Study
(NYC-HANES). Mouthwash samples were processed using using 16S v4 rRNA
amplicon sequencing. We examined differential abundance of 216
operational taxonomic units (OTUs), in addition to alpha and beta
diversity by sociodemographic variables including age, sex, income,
education, nativity, and race/ethnicity.
Results
69
OTUs were differentially abundant by any sociodemographic variable
(false discovery rate < 0.01), including 27 by race/ethnicity, 21 by
family income, 19 by education, three by sex. We found 67 by smoking
status, 18 by sugar-sweetened beverage consumption, nine by mouthwash
use. Genera differing for multiple sociodemographic characteristics
included Lactobacillus, Prevotella, Porphyromonas,
Fusobacterium.
Discussion
We identified
variations in the oral microbiome consistent with health inequalities,
with more taxa differing by race/ethnicity than sugar-sweetened beverage
consumption, and more by SES variables than mouthwash use. Further
investigation is warranted into possible mediating effects of the oral
microbiome in social disparities in diabetes, inflammation, oral health,
and preterm birth.
Results
The initial subsample included 297 participants; after removing
samples with less than 1000 reads, there were 282 participants remaining
for analysis. Table 1 shows sociodemographic variation in the final
analytic sample with respect to age (median [range]: 42 [20 to 94]),
gender (53.2% female), race/ethnicity (34.4% non-Hispanic White, 26.6%
non-Hispanic Black, 25.2% Hispanic), annual family income (42.7% less
than $30K, 33.3% $60k or more), and educational achievement (23.0% less
than high school diploma, 30.9% college degree or greater). Cramer’s V
on all pairwise combinations of sociodemographic variables indicated
only minor collinearity (all V<.35) (Supplemental Figure 1).
Relative Abundance and Alpha Diversity
Oral
microbiomes were characterized at the phylum level by a gradient between
Firmicutes and Bacteroides abundance, with overall dominance by
Firmicutes (mean=52±10%). Streptococcus was the most abundant genus
(36±10%) followed by Prevotella (17±8%). (Figure 1). The overall mean
chao1 was 462±118, with no differences by age group (p=0.79), gender NA,
educational achievement (p=0.92), annual family income (p=0.62), marital
status (p=0.54), race/ethnicity (p=0.13), or nativity (p=0.97, Figure
3). (Supplemental Figure 2) Differential Abundance and
Oligotyping
Numerous taxa were differentially abundant by race/ethnicity,
nativity, marital status, gender, family income tertiles, education, and
age groups. Figure 2a displays log fold change (logFC), or coefficient
from edgeR log linear models, for each comparison group and all
significant OTUs. A total of 69 OTUs were differentially abundant by any
sociodemographic variable, including 56 by age group, 27 by
race/ethnicity, 21 by family income, 19 by education, 19 by marital
status, seven by nativity, and three by gender. We also found nine by
mouthwash use, five by self-reported gum disease, 67 by smoking status,
and 18 by sugar-sweetened beverage consumption. The most frequently
differentially abundant were Lactobacillus (all variables), and
Prevotella (age, education, family income, marital status,
race/ethnicity, nativity, Figure 2a) Differential abundance findings for
selected taxa are presented in Table 2.
As numerous associations were present at FDR<0.01, we focus here
on findings where the logFC was 2 or greater. Compared to individuals
aged 20-34, individuals aged 65 and over displayed greater abundance of
Lactobacillus (logFC 2.9, FDR <0.0001), Lactococcus (logFC 2.5, FDR
0.001), Bifidobacterium (logFC 2.1, FDR 0.0002), and Scardovia (logFC
2.1, FDR 0.0005). Compared to individuals with a college degree or
greater, those with high school diploma or less showed greater abundance
of Pseudomonas (logFC 2, FDR 0.006), and those with some college or
associate’s degree showed greater abundance of Lactococcus (logFC 3, FDR
<0.0001), Lactobacillus (logFC 2.7, FDR <0.0001), Scardovia (logFC
2.6, FDR <0.0001), and Anaeroglobus (logFC 2.1, FDR 0.004).
Individuals with annual family incomes between $30,000 and $60,000 had
greater abundance of Lactobacillus (logFC 2.5, FDR <0.0001),
Scardovia (logFC 2.5, FDR <0.0001), Bifidobacterium (logFC 2.4, FDR
<0.0001), and Atopobium (logFC 2.2, FDR 0.0005), compared to those
making less than $30,000. Marital status showed a large number of strong
associations: compared to being married, those living with a partner
showed greater abundance of Atopobium (logFC 2.3, FDR 0.002), and
Prevotella (logFC 2.2, FDR 0.002), those separated showed greater
abundance of Leptotrichia (logFC 3, FDR 0.002), and those who were
widowed, greater abundance of Pseudomonas (logFC 4.1, FDR <0.0001),
and Candidatus Saccharimonas (logFC 2, FDR <0.0001). Compared to
non-Hispanic whites, non-Hispanic Blacks had greater abundance of
Lactococcus (logFC 2.9, FDR <0.0001), Anaeroglobus (logFC 2.3, FDR
<0.0001), Atopobium (logFC 2.2, FDR <0.0001), Lactobacillus (logFC
2.1, FDR <0.0001), and Campylobacter (logFC 2, FDR <0.0001).
Figure 3 displays the distribution of logFCs for both crude and
adjusted, including all OTUs with FDR <0.01 in crude models.
Adjusting for smoking, mouthwash use, age and gender, had a minor effect
on crude estimates; however, adjustment for smoking exerts the largest
effect on findings for age, income and education.
Analyzing
oligotypes of Neisseria, Prevotella, and Streptococcus revealed
associations not apparent in the OTU analysis, whereas some associations
present in OTU analysis were not apparent in oligotypes (Figure 2). New
associations were revealed between Prevotella and gender, Streptococcus
and gender, race/ethnicity and nativity, and Neisseria and gender, age,
education, marital status, race/ethnicity and nativity. Associations
present in OTUs but not in oligotyping were age, education and income in
Prevotella, and income in Neisseria.
Oligotype associations within
Neisseria for marital status, race/ethnicity, and nativity are each for
a mutually exclusive set of taxa, and associations with gender in
Neisseria, Prevotella, and Streptococcus are all in separate taxa from
the associations with other sociodemographic variables. Age group and
education had unidirectional associations in OTU analysis in
Streptococcus but bidirectional differential abundance in oligotypes. In
Prevotella, race/ethnicity had unidirectional associations in OTU
analysis but bidirectional associations in oligotypes.
Beta
Diversity and Clustering
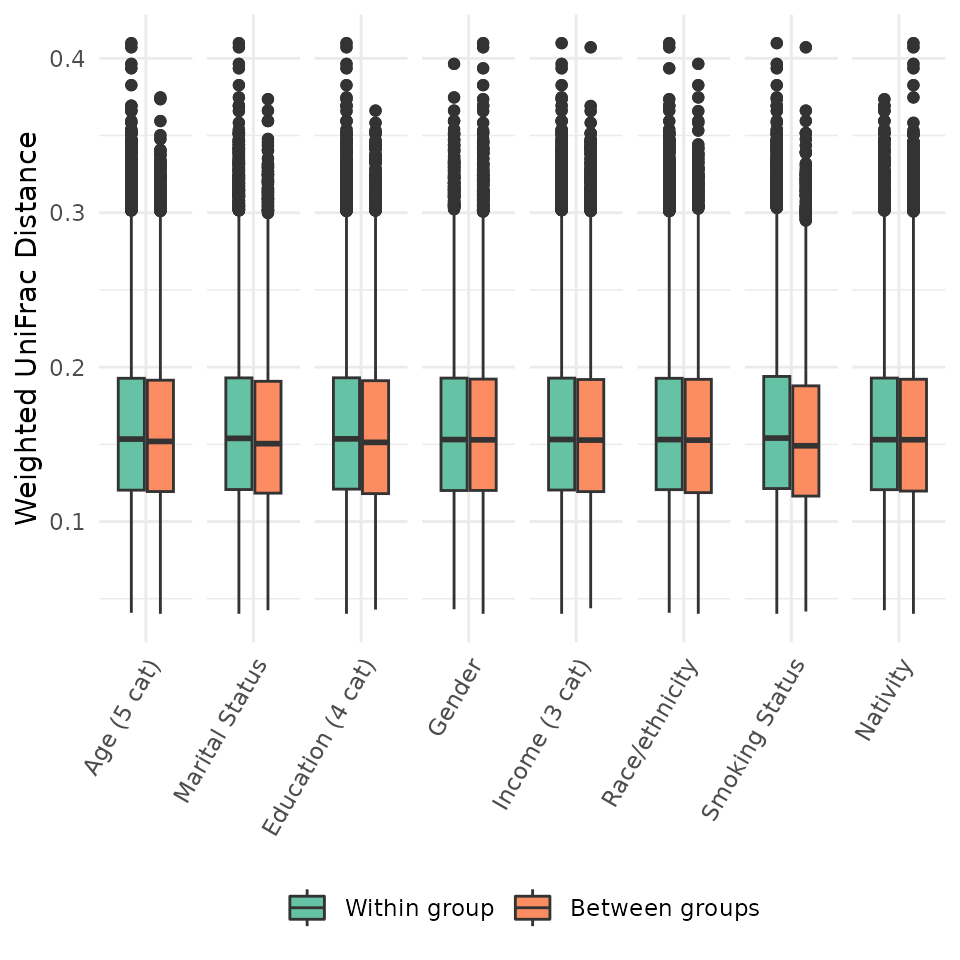
Figure 4 illustrates between-versus within-group weighted UniFrac
distances by each sociodemographic variable. We observed overall shifts
in composition by age group (p=0.017 \(r^2\)=0.025), education (p=0.017 \(r^2\)=0.025), and nativity (p=0.017 \(r^2\)=0.025), with no other variables
showing greater between- than within-group variation. Plots of the first
two principal coordinates based on weighted UniFrac distances showed
little patterning by any variable (not shown). Clustering scores were
sensitive to the distance metric used, with Bray-Curtis indicating
moderate support for 2 clusters (PS=0.86), and all other measures
providing little support for clustering.
Discussion
In a diverse population-based sample, we found that a large number of bacterial taxa were differentially abundant by age group, race/ethnicity, family income, education, nativity, and gender. Notably, we found a greater number of associations with SES variables (21 by family income, 19 by education) than with gender, marital status or nativity. There were more associations with SES than mouthwash use (nine ) or gum disease (five ), and a similar number of associations were found with sugar-sweetened beverage use (18 ). Sociodemographic associations were not appreciably diminished by adjustment for these factors. We also found that differential abundance by sociodemographic characteristics differed in oligotyping vs. OTUs, especially for Neisseria. Alpha diversity was similar across groups, and beta diversity explained only a small proportion of variance by age (2.9%), education 2.5%), and nativity 1%), and less by other variables. We found poor support for clustering of samples by OTUs, and that, similarly to Koren et al. (2013) (52), clustering findings were sensitive to the distance metric employed.
SessionInfo()
#> R version 4.3.3 (2024-02-29)
#> Platform: x86_64-pc-linux-gnu (64-bit)
#> Running under: Ubuntu 22.04.4 LTS
#>
#> Matrix products: default
#> BLAS:   /usr/lib/x86_64-linux-gnu/openblas-pthread/libblas.so.3
#> LAPACK: /usr/lib/x86_64-linux-gnu/openblas-pthread/libopenblasp-r0.3.20.so;  LAPACK version 3.10.0
#>
#> locale:
#>  [1] LC_CTYPE=C.UTF-8       LC_NUMERIC=C           LC_TIME=C.UTF-8
#>  [4] LC_COLLATE=C.UTF-8     LC_MONETARY=C.UTF-8    LC_MESSAGES=C.UTF-8
#>  [7] LC_PAPER=C.UTF-8       LC_NAME=C              LC_ADDRESS=C
#> [10] LC_TELEPHONE=C         LC_MEASUREMENT=C.UTF-8 LC_IDENTIFICATION=C
#>
#> time zone: UTC
#> tzcode source: system (glibc)
#>
#> attached base packages:
#> [1] stats     graphics  grDevices utils     datasets  methods   base
#>
#> other attached packages:
#>  [1] edgeR_4.0.16             limma_3.58.1             nychanesmicrobiome_0.1.2
#>  [4] lsr_0.5.2                Biobase_2.62.0           BiocGenerics_0.48.1
#>  [7] ggplot2_3.5.0            magrittr_2.0.3           dplyr_1.1.4
#> [10] vegan_2.6-4              lattice_0.22-5           permute_0.9-7
#> [13] ape_5.8                  phyloseq_1.46.0          BiocStyle_2.30.0
#>
#> loaded via a namespace (and not attached):
#>   [1] DBI_1.2.2               bitops_1.0-7            gridExtra_2.3
#>   [4] rlang_1.1.3             ade4_1.7-22             e1071_1.7-14
#>   [7] compiler_4.3.3          mgcv_1.9-1              systemfonts_1.0.6
#>  [10] vctrs_0.6.5             reshape2_1.4.4          stringr_1.5.1
#>  [13] pkgconfig_2.0.3         crayon_1.5.2            fastmap_1.1.1
#>  [16] XVector_0.42.0          labeling_0.4.3          utf8_1.2.4
#>  [19] rmarkdown_2.26          haven_2.5.4             ragg_1.3.0
#>  [22] purrr_1.0.2             xfun_0.43               zlibbioc_1.48.2
#>  [25] cachem_1.0.8            labelled_2.12.0         GenomeInfoDb_1.38.8
#>  [28] jsonlite_1.8.8          biomformat_1.30.0       highr_0.10
#>  [31] sas7bdat_0.7            rhdf5filters_1.14.1     Rhdf5lib_1.24.2
#>  [34] parallel_4.3.3          cluster_2.1.6           R6_2.5.1
#>  [37] RColorBrewer_1.1-3      bslib_0.7.0             stringi_1.8.3
#>  [40] jquerylib_0.1.4         Rcpp_1.0.12             bookdown_0.39
#>  [43] iterators_1.0.14        knitr_1.46              zoo_1.8-12
#>  [46] IRanges_2.36.0          Matrix_1.6-5            splines_4.3.3
#>  [49] igraph_2.0.3            tidyselect_1.2.1        rstudioapi_0.16.0
#>  [52] yaml_2.3.8              codetools_0.2-19        tibble_3.2.1
#>  [55] plyr_1.8.9              withr_3.0.0             evaluate_0.23
#>  [58] desc_1.4.3              survival_3.5-8          proxy_0.4-27
#>  [61] survey_4.4-2            xml2_1.3.6              Biostrings_2.70.3
#>  [64] pillar_1.9.0            BiocManager_1.30.22     foreach_1.5.2
#>  [67] stats4_4.3.3            generics_0.1.3          RCurl_1.98-1.14
#>  [70] S4Vectors_0.40.2        hms_1.1.3               munsell_0.5.1
#>  [73] scales_1.3.0            class_7.3-22            glue_1.7.0
#>  [76] tools_4.3.3             data.table_1.15.4       locfit_1.5-9.9
#>  [79] forcats_1.0.0           fs_1.6.3                rhdf5_2.46.1
#>  [82] grid_4.3.3              mitools_2.4             colorspace_2.1-0
#>  [85] nlme_3.1-164            GenomeInfoDbData_1.2.11 cli_3.6.2
#>  [88] kableExtra_1.4.0        textshaping_0.3.7       fansi_1.0.6
#>  [91] viridisLite_0.4.2       svglite_2.1.3           gtable_0.3.4
#>  [94] tableone_0.13.2         sass_0.4.9              digest_0.6.35
#>  [97] farver_2.1.1            htmlwidgets_1.6.4       memoise_2.0.1
#> [100] htmltools_0.5.8.1       pkgdown_2.0.8           multtest_2.58.0
#> [103] lifecycle_1.0.4         statmod_1.5.0           MASS_7.3-60.0.1
When I run edgeR comparing current cigarette vs. never smokers, I get 46 significant OTUs at FDR < 0.05, and when I run DESeq2, I get 48.