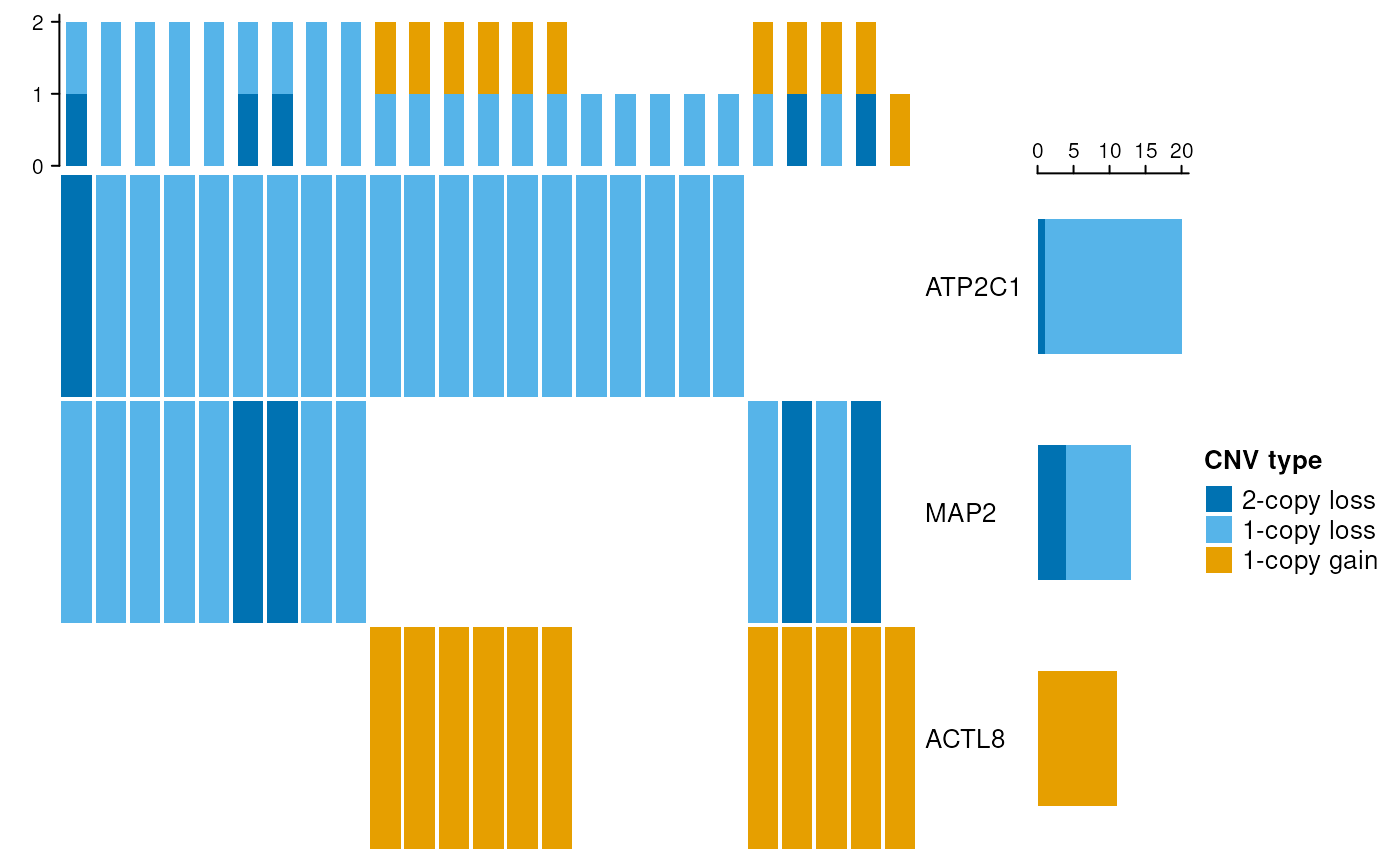
Illustrates overlaps between CNV calls and genomic features across a sample population.
Usage
cnvOncoPrint(
  calls,
  features,
  multi.calls = .largest,
  top.features = 25,
  top.samples = 100,
  ...
)
Arguments
- calls
Either a
GRangesListorRaggedExperimentstoring the individual CNV calls for each sample.- features
A
GRangesobject containing the genomic features of interest, typically genes. Feature names are either expected as a meta-columnsymbolor as thenamesof the object.- multi.calls
A function. Determines how to summarize the CN state in a CNV region when there are multiple (potentially conflicting) calls for one sample in that region. Defaults to
.largest, which assigns the CN state of the call that covers the largest part of the CNV region tested. A user-defined function that is passed on toqreduceAssaycan also be provided for customized behavior.- top.features
integer. Restricts the number of features for plotting to features experiencing highest alteration frequency. Defaults to 25. Use
-1to display all features.- top.samples
integer. Restricts the number of samples for plotting to samples experiencing highest alteration frequency. Defaults to 100. Use
-1to display all samples.- ...
Additional arguments passed on to
ComplexHeatmap::oncoPrint
Examples
# read in example CNV calls
data.dir <- system.file("extdata", package="CNVRanger")
call.file <- file.path(data.dir, "Silva16_PONE_CNV_calls.csv")
calls <- read.csv(call.file, as.is=TRUE)

# store in a GRangesList
calls <- makeGRangesListFromDataFrame(calls,
   split.field="NE_id", keep.extra.columns=TRUE)

# three example genes
genes <- c(  "chr1:140368053-140522639:-",
             "chr2:97843887-97988140:+",
             "chr2:135418586-135422028:-")
names(genes) <- c("ATP2C1", "MAP2", "ACTL8")
genes <- GRanges(genes)

# plot
cnvOncoPrint(calls, genes, top.samples = 25)