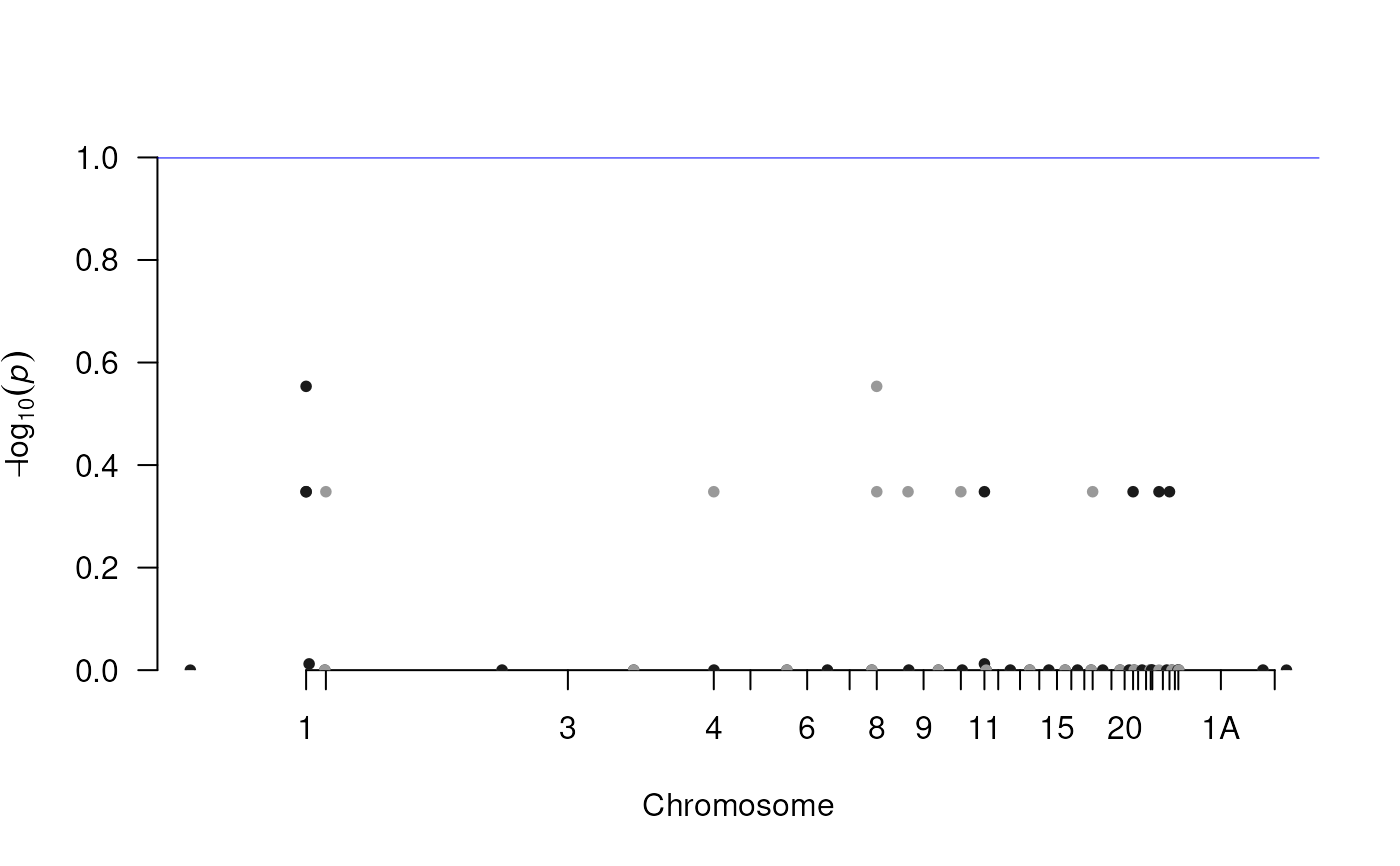
Manhattan plot for p-values of a CNV-GWAS
Arguments
- all.paths
Object returned from
CreateFolderTreefunction with the working folder tree- regions
- chr.size.order
data.framewith two columns: (i) 'chr': chromosome names (character), and (ii) 'size': length of the chromosomes in bp (integer). AGRangescontaining one chromosome per range can be used instead (the chromosomes should be in the expected order).- plot.pdf
Logical plot a to pdf file
Examples
# Load phenotype-CNV information
data.dir <- system.file("extdata", package="CNVRanger")

phen.loc <- file.path(data.dir, "Pheno.txt")
cnv.out.loc <- file.path(data.dir, "CNVOut.txt")
map.loc <- file.path(data.dir, "MapPenn.txt")

phen.info <- setupCnvGWAS('Example', phen.loc, cnv.out.loc, map.loc)
all.paths <- phen.info$all.paths
segs.pvalue.gr <- cnvGWAS(phen.info)

# Define the chromosome order in the plot
order.chrs <- c(1:24, "25LG1", "25LG2", 27:28, "LGE22", "1A", "4A")

# Chromosome sizes
chr.size.file <- file.path(data.dir, "Parus_major_chr_sizes.txt")
chr.sizes <- scan(chr.size.file)
chr.size.order <- data.frame(chr=order.chrs, sizes=chr.sizes, stringsAsFactors=FALSE)

# Plot Manhatthan to a pdf within the 'Results' workfolder
plotManhattan(all.paths, segs.pvalue.gr, chr.size.order)