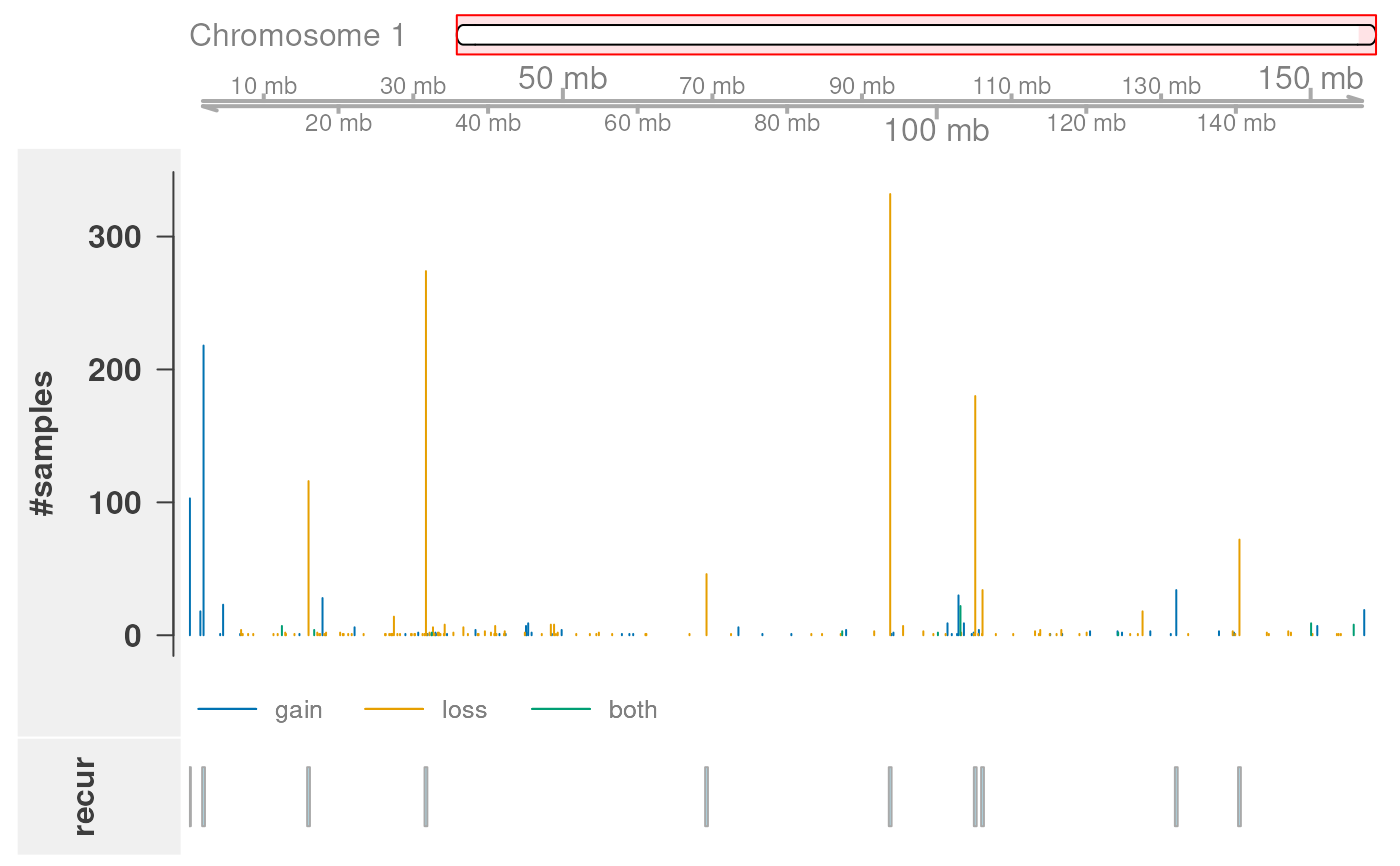
Illustrates summarized CNV regions along a chromosome.
Arguments
- regs
A
GRanges. Typically the result ofpopulationRangeswithest.recur=TRUE.- genome
Character. A valid UCSC genome assembly ID such as 'hg19' or 'bosTau6'.
- chr
Character. A UCSC-style chromosome name such as 'chr1'.
- pthresh
Numeric. Significance threshold for recurrence. Defaults to 0.05.
Examples
# read in example CNV calls
data.dir <- system.file("extdata", package="CNVRanger")
call.file <- file.path(data.dir, "Silva16_PONE_CNV_calls.csv")
calls <- read.csv(call.file, as.is=TRUE)

# store in a GRangesList
grl <- GenomicRanges::makeGRangesListFromDataFrame(calls,
   split.field="NE_id", keep.extra.columns=TRUE)

# summarize CNV regions
cnvrs <- populationRanges(grl, density=0.1, est.recur=TRUE)

# plot
plotRecurrentRegions(cnvrs, genome="bosTau6", chr="chr1")