PBMCs profiled with the Chromium Single Cell Multiome ATAC + Gene Expression from 10x
Marcel Ramos Pérez
Al J Abadi
Ricard Argelaguet
Levi Waldron
25 March 2026
Source:vignettes/scMultiome.Rmd
scMultiome.RmdInstallation
if (!requireNamespace("BiocManager", quietly = TRUE))
    install.packages("BiocManager")
BiocManager::install("SingleCellMultiModal")Description
This data set consists of about 10K Peripheral Blood Mononuclear Cells (PBMCs) derived from a single healthy donor. It is available from the 10x Genomics website.
Provided are the RNA expression counts quantified at the gene level
and the chromatin accessibility levels quantified at the peak level.
Here we provide the default peaks called by the CellRanger software. If
you want to explore other peak definitions or chromatin accessibility
quantifications (at the promoter level, etc.), you have download the
fragments.tsv.gz file from the 10x Genomics website.
Downloading datasets
The user can see the available dataset by using the default options
mae <- scMultiome("pbmc_10x", modes = "*", dry.run = FALSE, format = "MTX")## Working on: pbmc_atac_se.rds## Working on: pbmc_atac.mtx.gz## Working on: pbmc_rna_se.rds## Working on: pbmc_rna.mtx.gz## Working on: pbmc_atac,
## pbmc_rna## see ?SingleCellMultiModal and browseVignettes('SingleCellMultiModal') for documentation## loading from cache## Loading required namespace: HDF5Array## see ?SingleCellMultiModal and browseVignettes('SingleCellMultiModal') for documentation## loading from cache## Working on: pbmc_atac,
## pbmc_rna## see ?SingleCellMultiModal and browseVignettes('SingleCellMultiModal') for documentation## loading from cache## see ?SingleCellMultiModal and browseVignettes('SingleCellMultiModal') for documentation## loading from cache## Working on: pbmc_colData## Working on: pbmc_sampleMap## see ?SingleCellMultiModal and browseVignettes('SingleCellMultiModal') for documentation## loading from cache## see ?SingleCellMultiModal and browseVignettes('SingleCellMultiModal') for documentation## loading from cacheExploring the data structure
There are two assays: rna and atac, stored
as SingleCellExperiment
objects
mae## A MultiAssayExperiment object of 2 listed
## experiments with user-defined names and respective classes.
## Containing an ExperimentList class object of length 2:
## [1] atac: SingleCellExperiment with 108344 rows and 10032 columns
## [2] rna: SingleCellExperiment with 36549 rows and 10032 columns
## Functionality:
## experiments() - obtain the ExperimentList instance
## colData() - the primary/phenotype DataFrame
## sampleMap() - the sample coordination DataFrame
## `$`, `[`, `[[` - extract colData columns, subset, or experiment
## *Format() - convert into a long or wide DataFrame
## assays() - convert ExperimentList to a SimpleList of matrices
## exportClass() - save data to flat fileswhere the cells are the same in both assays:
upsetSamples(mae)## Warning: `aes_string()` was deprecated in ggplot2 3.0.0.
## ℹ Please use tidy evaluation idioms with `aes()`.
## ℹ See also `vignette("ggplot2-in-packages")` for more information.
## ℹ The deprecated feature was likely used in the UpSetR package.
## Please report the issue to the authors.
## This warning is displayed once per session.
## Call `lifecycle::last_lifecycle_warnings()` to see where this warning was
## generated.## Warning: Using `size` aesthetic for lines was deprecated in ggplot2 3.4.0.
## ℹ Please use `linewidth` instead.
## ℹ The deprecated feature was likely used in the UpSetR package.
## Please report the issue to the authors.
## This warning is displayed once per session.
## Call `lifecycle::last_lifecycle_warnings()` to see where this warning was
## generated.## Warning: The `size` argument of `element_line()` is deprecated as of ggplot2 3.4.0.
## ℹ Please use the `linewidth` argument instead.
## ℹ The deprecated feature was likely used in the UpSetR package.
## Please report the issue to the authors.
## This warning is displayed once per session.
## Call `lifecycle::last_lifecycle_warnings()` to see where this warning was
## generated.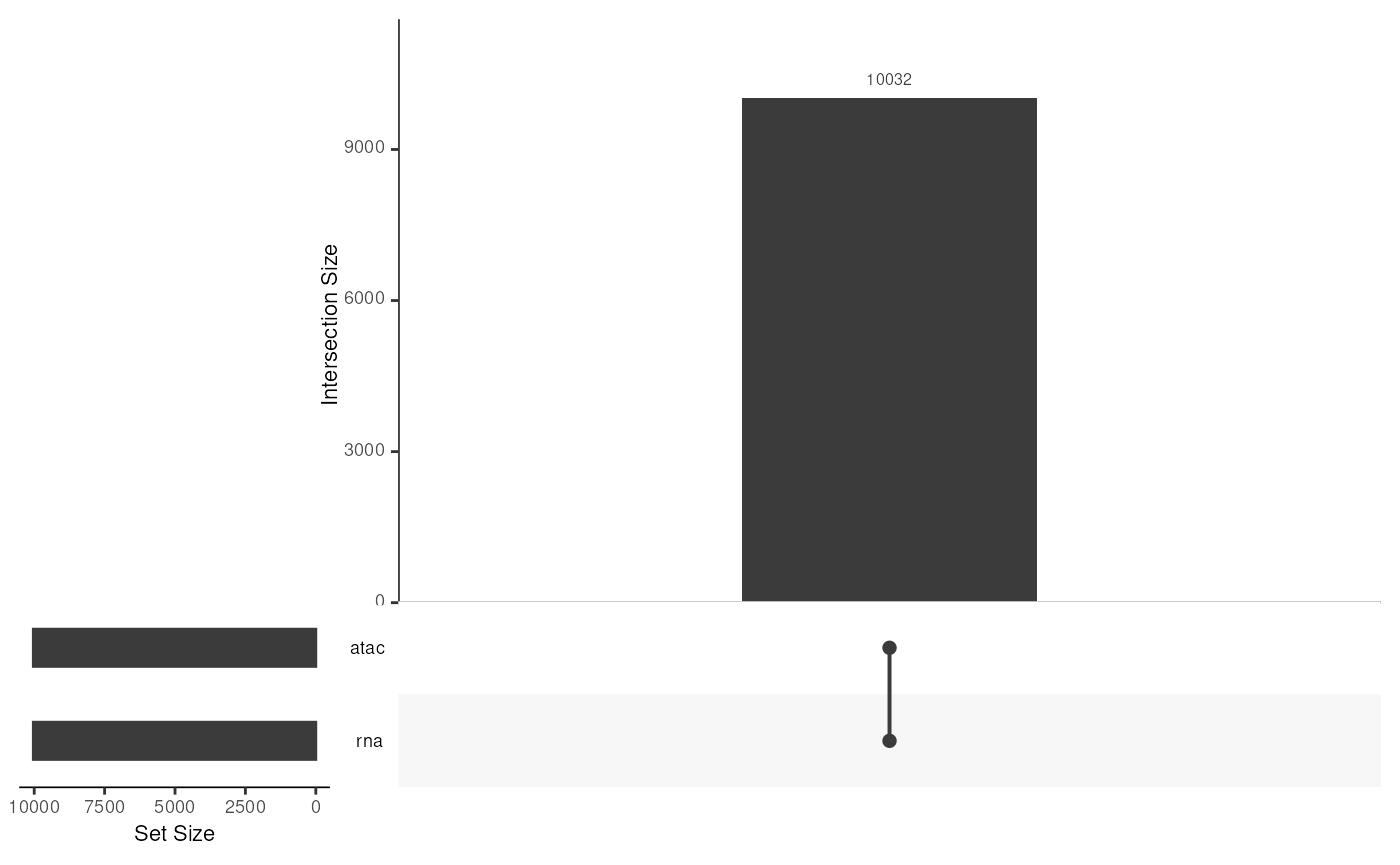
Cell metadata
Columns:
- nCount_RNA: number of read counts
- nFeature_RNA: number of genes with at least one read count
- nCount_ATAC: number of ATAC read counts
- nFeature_ATAC: number of ATAC peaks with at least one read count
- celltype: The cell types have been annotated by the 10x Genomics R&D team using gene markers. They provide a rough characterisation of the cell type diversity, but keep in mind that they are not ground truth labels.
-
broad_celltype:
LymphoidorMyeloidorigin
The cells have not been QC-ed, choosing a minimum number of genes/peaks per cell depends is left to you! In addition, there are further quality control criteria that you may want to apply, including mitochondrial coverage, fraction of reads overlapping ENCODE Blacklisted regions, Transcription start site enrichment, etc. See suggestions below for software that can perform a semi-automated quality control pipeline
## DataFrame with 6 rows and 6 columns
##                  nCount_RNA nFeature_RNA nCount_ATAC nFeature_ATAC
##                   <integer>    <integer>   <integer>     <integer>
## AAACAGCCAAGGAATC       8380         3308       55582         13878
## AAACAGCCAATCCCTT       3771         1896       20495          7253
## AAACAGCCAATGCGCT       6876         2904       16674          6528
## AAACAGCCAGTAGGTG       7614         3061       39454         11633
## AAACAGCCAGTTTACG       3633         1691       20523          7245
## AAACAGCCATCCAGGT       7782         3028       22412          8602
##                                celltype broad_celltype
##                             <character>    <character>
## AAACAGCCAAGGAATC      naive CD4 T cells       Lymphoid
## AAACAGCCAATCCCTT     memory CD4 T cells       Lymphoid
## AAACAGCCAATGCGCT      naive CD4 T cells       Lymphoid
## AAACAGCCAGTAGGTG      naive CD4 T cells       Lymphoid
## AAACAGCCAGTTTACG     memory CD4 T cells       Lymphoid
## AAACAGCCATCCAGGT non-classical monocy..        Myeloid
RNA expression
The RNA expression consists of 36,549 genes and 10,032 cells, stored
using the dgCMatrix sparse matrix format
dim(experiments(mae)[["rna"]])## [1] 36549 10032
names(experiments(mae))## [1] "atac" "rna"Let’s do some standard dimensionality reduction plot:
sce.rna <- experiments(mae)[["rna"]]

# Normalisation
sce.rna <- logNormCounts(sce.rna)

# Feature selection
decomp <- modelGeneVar(sce.rna)
hvgs <- rownames(decomp)[decomp$mean>0.01 & decomp$p.value <= 0.05]
sce.rna <- sce.rna[hvgs,]

# PCA
sce.rna <- runPCA(sce.rna, ncomponents = 25)

# UMAP
set.seed(42)
sce.rna <- runUMAP(sce.rna, dimred="PCA", n_neighbors = 25, min_dist = 0.3)
plotUMAP(sce.rna, colour_by="celltype", point_size=0.5, point_alpha=1)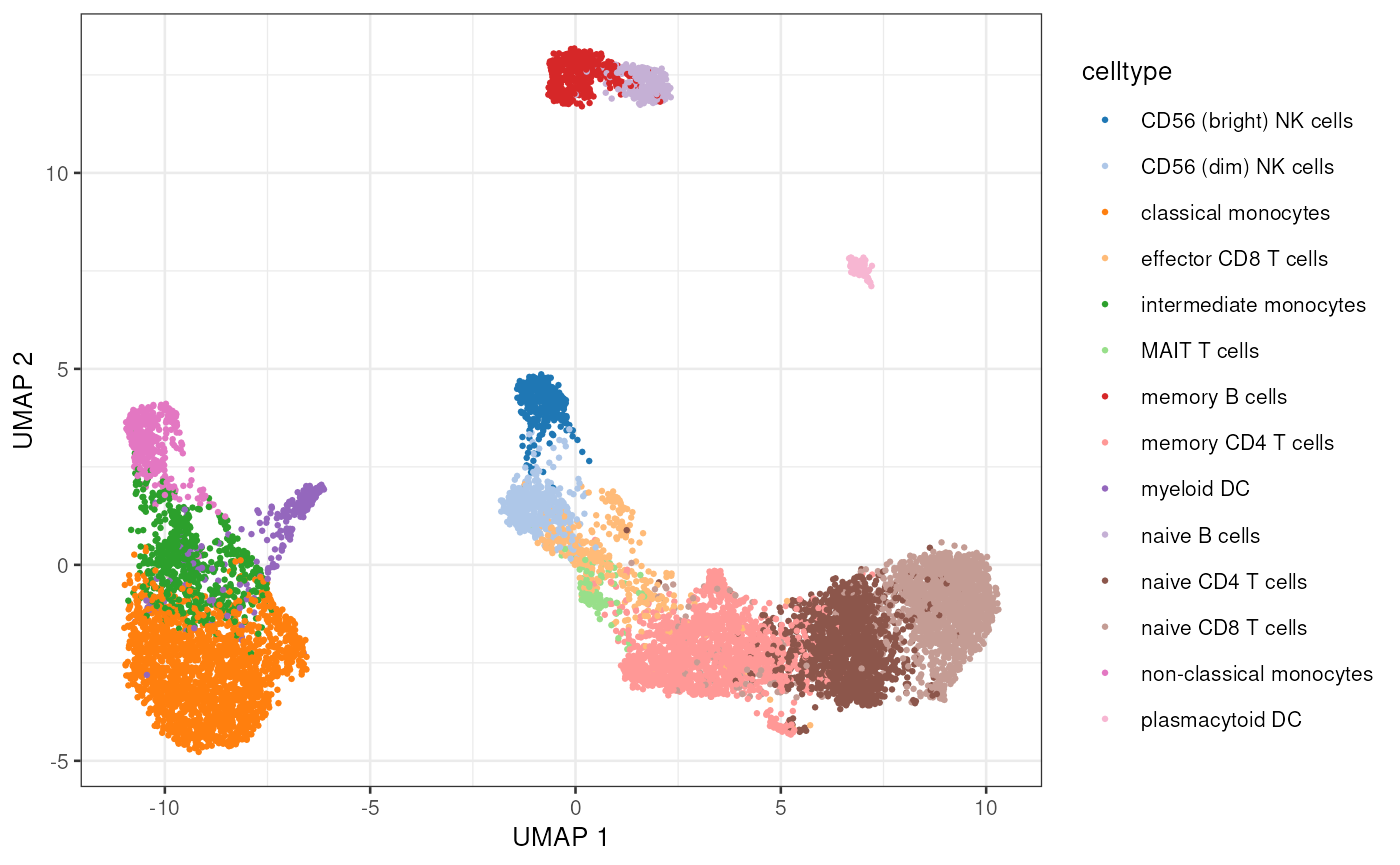
Chromatin Accessibility
The ATAC expression consists of 108,344 peaks and 10,032 cells:
dim(experiments(mae)[["atac"]])## [1] 108344 10032Let’s do some standard dimensionality reduction plot. Note that
scATAC-seq data is sparser than scRNA-seq, almost binary. The log
normalisation + PCA approach that scater implements for
scRNA-seq is not a good strategy for scATAC-seq data. Topic modelling or
TFIDF+SVD are a better strategy. Please see the package recommendations
below.
sce.atac <- experiments(mae)[["atac"]]

# Normalisation
sce.atac <- logNormCounts(sce.atac)

# Feature selection
decomp <- modelGeneVar(sce.atac)
hvgs <- rownames(decomp)[decomp$mean>0.25]
sce.atac <- sce.atac[hvgs,]

# PCA
sce.atac <- runPCA(sce.atac, ncomponents = 25)

# UMAP
set.seed(42)
sce.atac <- runUMAP(sce.atac, dimred="PCA", n_neighbors = 25, min_dist = 0.3)
plotUMAP(sce.atac, colour_by="celltype", point_size=0.5, point_alpha=1)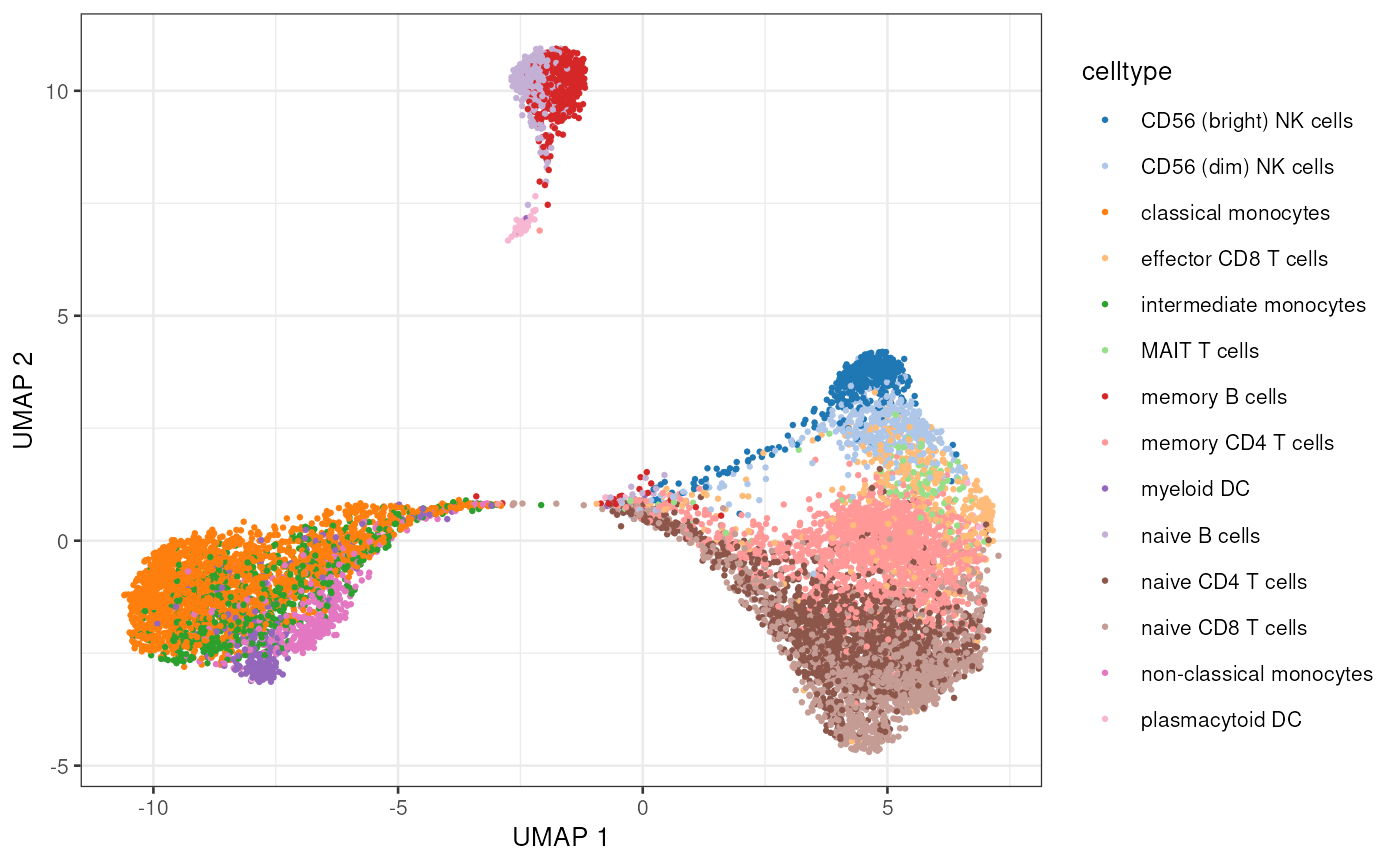
Suggested software for the downstream analysis
These are my personal recommendations of R-based analysis software:
sessionInfo
## R Under development (unstable) (2026-03-22 r89674)
## Platform: x86_64-pc-linux-gnu
## Running under: Ubuntu 24.04.4 LTS
##
## Matrix products: default
## BLAS:   /usr/lib/x86_64-linux-gnu/openblas-pthread/libblas.so.3
## LAPACK: /usr/lib/x86_64-linux-gnu/openblas-pthread/libopenblasp-r0.3.26.so;  LAPACK version 3.12.0
##
## locale:
##  [1] LC_CTYPE=en_US.UTF-8       LC_NUMERIC=C
##  [3] LC_TIME=en_US.UTF-8        LC_COLLATE=en_US.UTF-8
##  [5] LC_MONETARY=en_US.UTF-8    LC_MESSAGES=en_US.UTF-8
##  [7] LC_PAPER=en_US.UTF-8       LC_NAME=C
##  [9] LC_ADDRESS=C               LC_TELEPHONE=C
## [11] LC_MEASUREMENT=en_US.UTF-8 LC_IDENTIFICATION=C
##
## time zone: Etc/UTC
## tzcode source: system (glibc)
##
## attached base packages:
## [1] stats4    stats     graphics  grDevices utils     datasets  methods
## [8] base
##
## other attached packages:
##  [1] scater_1.39.3               ggplot2_4.0.2
##  [3] scran_1.39.1                scuttle_1.21.0
##  [5] SingleCellExperiment_1.33.2 SingleCellMultiModal_1.22.0
##  [7] MultiAssayExperiment_1.37.2 SummarizedExperiment_1.41.1
##  [9] Biobase_2.71.0              GenomicRanges_1.63.1
## [11] Seqinfo_1.1.0               IRanges_2.45.0
## [13] S4Vectors_0.49.0            BiocGenerics_0.57.0
## [15] generics_0.1.4              MatrixGenerics_1.23.0
## [17] matrixStats_1.5.0           BiocStyle_2.39.0
##
## loaded via a namespace (and not attached):
##   [1] RColorBrewer_1.1-3       jsonlite_2.0.0           magrittr_2.0.4
##   [4] ggbeeswarm_0.7.3         magick_2.9.1             farver_2.1.2
##   [7] rmarkdown_2.30           fs_2.0.1                 ragg_1.5.2
##  [10] vctrs_0.7.2              memoise_2.0.1            htmltools_0.5.9
##  [13] S4Arrays_1.11.1          BiocBaseUtils_1.13.0     AnnotationHub_4.1.0
##  [16] curl_7.0.0               BiocNeighbors_2.5.4      Rhdf5lib_1.33.6
##  [19] SparseArray_1.11.11      rhdf5_2.55.16            sass_0.4.10
##  [22] bslib_0.10.0             htmlwidgets_1.6.4        desc_1.4.3
##  [25] plyr_1.8.9               httr2_1.2.2              cachem_1.1.0
##  [28] igraph_2.2.2             lifecycle_1.0.5          pkgconfig_2.0.3
##  [31] rsvd_1.0.5               Matrix_1.7-5             R6_2.6.1
##  [34] fastmap_1.2.0            digest_0.6.39            AnnotationDbi_1.73.0
##  [37] RSpectra_0.16-2          dqrng_0.4.1              irlba_2.3.7
##  [40] ExperimentHub_3.1.0      textshaping_1.0.5        RSQLite_2.4.6
##  [43] beachmat_2.27.3          filelock_1.0.3           labeling_0.4.3
##  [46] httr_1.4.8               abind_1.4-8              compiler_4.6.0
##  [49] bit64_4.6.0-1            withr_3.0.2              S7_0.2.1
##  [52] BiocParallel_1.45.0      viridis_0.6.5            DBI_1.3.0
##  [55] UpSetR_1.4.0             HDF5Array_1.39.0         rappdirs_0.3.4
##  [58] DelayedArray_0.37.0      rjson_0.2.23             bluster_1.21.1
##  [61] tools_4.6.0              vipor_0.4.7              otel_0.2.0
##  [64] beeswarm_0.4.0           glue_1.8.0               h5mread_1.3.2
##  [67] rhdf5filters_1.23.3      grid_4.6.0               cluster_2.1.8.2
##  [70] gtable_0.3.6             BiocSingular_1.27.1      ScaledMatrix_1.19.0
##  [73] metapod_1.19.2           XVector_0.51.0           RcppAnnoy_0.0.23
##  [76] ggrepel_0.9.8            BiocVersion_3.23.1       pillar_1.11.1
##  [79] limma_3.67.0             dplyr_1.2.0              BiocFileCache_3.1.0
##  [82] lattice_0.22-9           bit_4.6.0                tidyselect_1.2.1
##  [85] locfit_1.5-9.12          Biostrings_2.79.5        knitr_1.51
##  [88] gridExtra_2.3            bookdown_0.46            edgeR_4.9.4
##  [91] xfun_0.57                statmod_1.5.1            yaml_2.3.12
##  [94] evaluate_1.0.5           codetools_0.2-20         tibble_3.3.1
##  [97] BiocManager_1.30.27      cli_3.6.5                uwot_0.2.4
## [100] systemfonts_1.3.2        jquerylib_0.1.4          Rcpp_1.1.1
## [103] dbplyr_2.5.2             png_0.1-9                parallel_4.6.0
## [106] pkgdown_2.2.0            blob_1.3.0               SpatialExperiment_1.21.0
## [109] viridisLite_0.4.3        scales_1.4.0             purrr_1.2.1
## [112] crayon_1.5.3             rlang_1.1.7              KEGGREST_1.51.1