curatedBreastData Manual
Katie Planey
Source:vignettes/curatedBreastData-manual.Rmd
curatedBreastData-manual.RmdIntroduction
curatedBreastData contained 34 high-quality GEO gene expression microarray datasets, all with advanced breast cancer. These datasets all contain at least one survival and/or treatment response variable, and minimal treamtent information (such as whether they had chemotherapy or not.) Clinical variables were semantically normalized across all datasets to provide a powerful database for investigating genes that are related to clinical variables such as pathological complete response, ER and HER2 IHC pathology tests, pam50 subtyping tests (when available), and tumor stage.
This database was original designed as a MySQL database, but has been re-represented as S4 ExpressionObjects with attached clinical data (phenoData) for easier data analyses in R.
Prerequisites
The package curatedBreastData requires minimal
external packages; it requires impute.knn from the impute
package and the ggplot2 package for optional plots during
data matrix processing, and the CRAN package XML (which uses RCurl). It
also uses Biobase, Bioconductor’s base package, for the
ExpressionSet and its accessor functions.
The database
The schema of both the microarray datasets and the corresponding clinical data is detailed in proceedings from the 2013 AMIA Joint Summit on Translational Bioinformatics Planey et al. titled “Database integration of 4923 publicly-available samples of breast cancer molecular and clinical data.”. The data presented in this package contains 2719 samples; the “missing” samples are from a dataset that is only available via a restricted data request (the 2000-sample METABRIC study) and thus is not given here (however any researcher can request the data via EBI: http://www.ebi.ac.uk/)
Whenever possible, raw data was used. Authors of linked publications to each GEO dataset were directly contacted for additional clinical information, and we are grateful for the authors who responded and kindly shared additional clinical data that we added to this package.
The database schema is shown in the figure below.
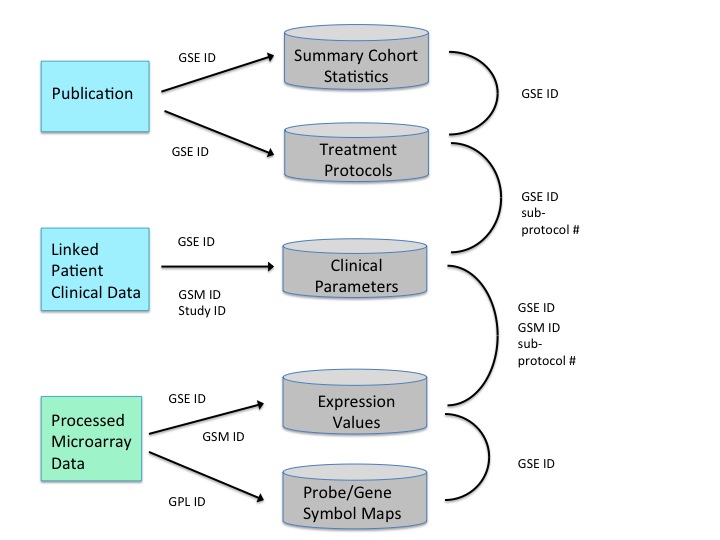
Careful processing steps were taken before any normalization, such as removing duplicated patient samples within and between datasets. For example, GSE2226, the UCSF I-SPY study, actually had samples that overlapped with samples from GSE25055, an MD-Anderson study. While rare, the author took care to keep original I-SPY samples only in the GSE22226 dataset and remove them from the GSE25055 dataset.
Additionally, samples names were inspected to infer whether clear batches within a dataset existed. Often times, a multi-site GEO dataset would have samples labeled with the patient name and the country, such as “Spain” or “Portugal”. Such data tags imply the samples were collected at different sites. When such data was available, batch datasets were treated as separate datasts. GSE2226 also contained batches, but because two microarray platforms were used. These batch effects can indeed lead to differences in gene expression levels; especially for a meta-analysis, these should be treated as separate datasets.
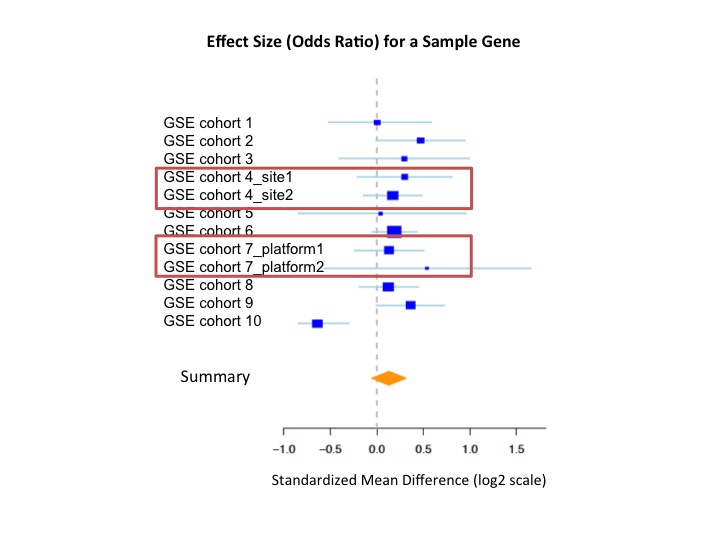
A real-life example of this for a selected gene across several datasets in the package is shown below. The effect size for each dataset is measured. As one can see, the two different tissue collection sites for study 4 and the two differnt platforms used in study 7 manifest themselves in clear batches in both studies that result in differing microarray expression levels. Thus, they are treated as two, and not one, dataset for each of these studies.
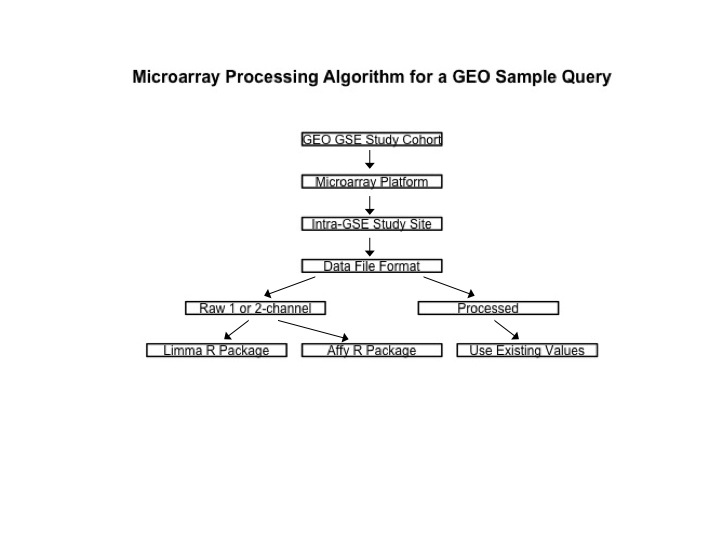
The data objects in the curatedBreastDataExprSetList list provided in this package have already been normalized according to the protocol outlined below. Original scripts used for each original dataset can be found on the Github repository https://github.com/kplaney/curatedBreastCancer. This repository also contains results from a data quality check test in RMarkdown, and more notes on microarray processing.
Analysis
Gene expression datasets must be post-processed after normalization;
curatedBreastData provides functions for removing
samples and genes that have high NA rates, imputing missing values,
collapsing duplicated genes or probes, removing duplicated patient
samples, and filtering genes by variance. Documentation for each
function is providing in its corresponding Rd documentation file. The
wrapper function processExpressionSetList() completes all
these post-processing steps on a list of S4 ExpressionSet objects like
the curatedBreastDataExprSetList.rda list provided in this package.
This package works with expression data in the form of S4 ExpressionSet objects and/or lists of S4 ExpressionSet objects. In this example workflow, we load up all of the datasets.
## Loading required package: XML## Loading required package: ggplot2## Loading required package: impute## Loading required package: Biobase## Loading required package: BiocGenerics## Loading required package: generics##
## Attaching package: 'generics'## The following objects are masked from 'package:base':
##
## as.difftime, as.factor, as.ordered, intersect, is.element, setdiff,
## setequal, union##
## Attaching package: 'BiocGenerics'## The following objects are masked from 'package:stats':
##
## IQR, mad, sd, var, xtabs## The following objects are masked from 'package:base':
##
## anyDuplicated, aperm, append, as.data.frame, basename, cbind,
## colnames, dirname, do.call, duplicated, eval, evalq, Filter, Find,
## get, grep, grepl, is.unsorted, lapply, Map, mapply, match, mget,
## order, paste, pmax, pmax.int, pmin, pmin.int, Position, rank,
## rbind, Reduce, rownames, sapply, saveRDS, table, tapply, unique,
## unsplit, which.max, which.min## Welcome to Bioconductor
##
## Vignettes contain introductory material; view with
## 'browseVignettes()'. To cite Bioconductor, see
## 'citation("Biobase")', and for packages 'citation("pkgname")'.## Warning in fun(libname, pkgname): Package 'curatedBreastData' is deprecated and will be removed from
## Bioconductor version 3.24
#load up datasets that are in S4 expressionSet format.
#clinical data from master clinicalTable already linked to each sample
#in these ExpressionSets in the phenoData slot.
curatedBreastDataExprSetList <- getCuratedBreastDataExprSetList(test=TRUE);
We can see that clinical data for each dataset is included in the phenoData slot.
#check out the clinical data for dataset 1
#first look at the GEO study name
names(curatedBreastDataExprSetList)[1]
## [1] "study_1379_GPL1223_all"
#only take the first 3 patients for sake of printing to screen
#look at first 10 clinical variables
head(pData(curatedBreastDataExprSetList[[1]])[c(1:3), c(1:10)])
## datasetName dbUniquePatientID study_ID.x patient_ID GEO_GSMID
## 22449 study_1379_GPL1223_all 925 1379 22449 22449
## 22450 study_1379_GPL1223_all 926 1379 22450 22450
## 22451 study_1379_GPL1223_all 927 1379 22451 22451
## platform_ID GEO_platform_ID AE_platform_ID coordinating_GSE_series_GSMID
## 22449 1223 GPL1223 <NA> 22365
## 22450 1223 GPL1223 <NA> 22366
## 22451 1223 GPL1223 <NA> 22367
## original_study_ID
## 22449 25
## 22450 59
## 22451 68We then post-process this data. Let’s say we only want the top 5000 genes by variance for each dataset. This can take a few minutes as we’re post-processing 34 datasets. This takes a while, so it’s not included in the examples() section.
#process only the first two datasets to avoid a long-running example:
#take top 5000 genes by variance from each dataset.
proc_curatedBreastDataExprSetList <- processExpressionSetList(exprSetList=curatedBreastDataExprSetList[1:2], outputFileDirectory = tempdir(), numTopVarGenes=5000)
##
## Analyzing dataset 1 or dataset named study_1379_GPL1223_all##
## Note: this function assumes your missing values
## are proper NAs, not "null",etc.## It's best to impute NA values before running this function
## otherwise it may set averages to NA if there is 1 NA present.
## This function just removes any genes whose key is NA.##
## You may get a notification here because key (usually gene) names are
## duplicated so it can't use them as row names.
## That's OK, because we are immediately collapsing them into one feature.##
## Starting with 30patients.## found no multiple samples from the same patient(s)##
## Analyzing dataset 2 or dataset named study_2034_GPL96_all##
## Note: this function assumes your missing values
## are proper NAs, not "null",etc.## It's best to impute NA values before running this function
## otherwise it may set averages to NA if there is 1 NA present.
## This function just removes any genes whose key is NA.##
## You may get a notification here because key (usually gene) names are
## duplicated so it can't use them as row names.
## That's OK, because we are immediately collapsing them into one feature.##
## Starting with 30patients.## found no multiple samples from the same patient(s)Now we have processed expression matrices, each with the top 5000 genes by variance. We can then begin to explore what clinical variables we could use to run a meta-analysis or supervised analysis with all of this data.
All clinical variables are semantically normalized/have the same names across all datasets in the list. This is helpful, but oftentimes, we want to know if we have enough patients with certain clinical variables across all datasets. The global clinicalTable data frame provided in curatedBreastData combines all of the clinical data across all datasets.
Treatment data has been carefully curated and aggregtaed into semantically normalized variables so that a user can both determine which patients received a therapy, and then control for these variables in analyses. For example, using the master clinicalData table, we can quickly determine how many patients ever had chemotherapy. The user can also inspect specific classes of chemotherapy, such as taxanes. Whenever granular therapy information was provided, it was recorded in the clinicalTable (otherwise, it was left as NA.)
#load up master clinical data table
clinicalData <- getClinicalData(test=TRUE)
#look at some of the clinical variable name definitions
clinicalData$clinicalVarDef[c(1:2),]
## variableName
## dbUniquePatientID dbUniquePatientID
## study_ID study_ID
## definition.NA.means.not.recorded
## dbUniquePatientID Unique patient id created for this database.
## study_ID GEO GSE study ID.
#Check out the treatment information.
#just do first three patients
head(clinicalData$clinicalTable)[c(1:3),
                                 c(112:ncol(clinicalData$clinicalTable))]
## aromatase_inhibitor estrogen_receptor_blocker
## 117 0 0
## 118 0 0
## 119 0 0
## estrogen_receptor_blocker_and_stops_production
## 117 0
## 118 0
## 119 0
## estrogen_receptor_blocker_and_eliminator anti_HER2 tamoxifen doxorubicin
## 117 0 0 0 0
## 118 0 0 0 0
## 119 0 0 0 0
## epirubicin docetaxel capecitabine fluorouracil paclitaxel cyclophosphamide
## 117 0 0 0 0 0 0
## 118 0 0 0 0 0 0
## 119 0 0 0 0 0 0
## anastrozole fulvestrant gefitinib trastuzumab letrozole chemotherapy
## 117 0 0 0 0 0 0
## 118 0 0 0 0 0 0
## 119 0 0 0 0 0 0
## hormone_therapy no_treatment methotrexate cetuximab carboplatin other
## 117 0 0 0 0 0 0
## 118 0 0 0 0 0 0
## 119 0 0 0 0 0 0
## taxaneGeneral neoadjuvant_or_adjuvant study_specific_protocol_number
## 117 0 adj 1
## 118 0 adj 1
## 119 0 adj 1
#how many had chemotherapy?
numChemoPatients <- length(which(
  clinicalData$clinicalTable$chemotherapyClass==1))
#around 1500 had chemotherapy
numChemoPatients
## [1] 0
#which patients specifically had a taxane chemotherapy?
numChemoTaxane <- length(which(clinicalData$clinicalTable$taxane==1))
numChemoTaxane
## [1] 0We can also look at adjuvant vs. neoadjuvant therapy.
#how many had adjuvant therapy?
numAdjPatients <- length(which(
  clinicalData$clinicalTable$neoadjuvant_or_adjuvant=="adj"))
#over a 1000 had (documented) adjuvant therapy
numAdjPatients
## [1] 60The curatedBreastData_pData Dataset
As a convenience, the package also provides
curatedBreastData_pData, which is a single,
pre-concatenated data.frame containing the
pData (phenotypic and clinical metadata) from all of the
datasets in curatedBreastDataExprSetList. Rownames
correspond to the sample IDs.
You can load this dataset directly using the standard
data() function:
# Load the pre-concatenated pData dataset
data(curatedBreastData_pData)

# View its dimensions and structure
dim(curatedBreastData_pData)
## [1] 2719 153
head(curatedBreastData_pData)[1:5, 1:5]## datasetName dbUniquePatientID
## study_1379_GPL1223_all.22449 study_1379_GPL1223_all 925
## study_1379_GPL1223_all.22450 study_1379_GPL1223_all 926
## study_1379_GPL1223_all.22451 study_1379_GPL1223_all 927
## study_1379_GPL1223_all.22452 study_1379_GPL1223_all 928
## study_1379_GPL1223_all.22453 study_1379_GPL1223_all 929
## study_ID.x patient_ID GEO_GSMID
## study_1379_GPL1223_all.22449 1379 22449 22449
## study_1379_GPL1223_all.22450 1379 22450 22450
## study_1379_GPL1223_all.22451 1379 22451 22451
## study_1379_GPL1223_all.22452 1379 22452 22452
## study_1379_GPL1223_all.22453 1379 22453 22453The clinicalTable data frame can allow us to then select the relevant patients from each dataset who have the outcomes variable we want. For example, we inspect the number of samples with data pertaining to Overall Survival below.
## [1] 0
#how many have OS data in the more granular form of months until OS?
#this variable includes studies that had a cieling for tracking OS
length(which(!is.na(clinicalData$clinicalTable$OS_months_or_MIN_months_of_OS)))
## [1] 0
#how many patients have OS information that is definitively
#followed up until their death (details on how studies collect OS data can be surprising!)
length(which(!is.na(clinicalData$clinicalTable$OS_up_until_death)))
## [1] 0
#finish up with sessionInfo
sessionInfo()
## R version 4.6.1 (2026-06-24)
## Platform: x86_64-pc-linux-gnu
## Running under: Ubuntu 24.04.4 LTS
##
## Matrix products: default
## BLAS: /usr/lib/x86_64-linux-gnu/openblas-pthread/libblas.so.3
## LAPACK: /usr/lib/x86_64-linux-gnu/openblas-pthread/libopenblasp-r0.3.26.so; LAPACK version 3.12.0
##
## locale:
## [1] LC_CTYPE=en_US.UTF-8 LC_NUMERIC=C
## [3] LC_TIME=en_US.UTF-8 LC_COLLATE=en_US.UTF-8
## [5] LC_MONETARY=en_US.UTF-8 LC_MESSAGES=en_US.UTF-8
## [7] LC_PAPER=en_US.UTF-8 LC_NAME=C
## [9] LC_ADDRESS=C LC_TELEPHONE=C
## [11] LC_MEASUREMENT=en_US.UTF-8 LC_IDENTIFICATION=C
##
## time zone: Etc/UTC
## tzcode source: system (glibc)
##
## attached base packages:
## [1] stats graphics grDevices utils datasets methods base
##
## other attached packages:
## [1] curatedBreastData_2.40.2 Biobase_2.72.0 BiocGenerics_0.58.1
## [4] generics_0.1.4 impute_1.86.0 ggplot2_4.0.3
## [7] XML_3.99-0.23 BiocStyle_2.40.0
##
## loaded via a namespace (and not attached):
## [1] sass_0.4.10 RSQLite_3.53.3 digest_0.6.39
## [4] magrittr_2.0.5 evaluate_1.0.5 grid_4.6.1
## [7] RColorBrewer_1.1-3 fastmap_1.2.0 blob_1.3.0
## [10] jsonlite_2.0.0 DBI_1.3.0 BiocManager_1.30.27
## [13] scales_1.4.0 httr2_1.3.0 textshaping_1.0.5
## [16] jquerylib_0.1.4 cli_3.6.6 rlang_1.3.0
## [19] dbplyr_2.6.0 bit64_4.8.2 withr_3.0.3
## [22] cachem_1.1.0 yaml_2.3.12 otel_0.2.0
## [25] tools_4.6.1 memoise_2.0.1 dplyr_1.2.1
## [28] filelock_1.0.3 curl_7.1.0 vctrs_0.7.3
## [31] R6_2.6.1 lifecycle_1.0.5 BiocFileCache_3.2.0
## [34] fs_2.1.0 htmlwidgets_1.6.4 bit_4.6.0
## [37] ragg_1.5.2 pkgconfig_2.0.3 desc_1.4.3
## [40] pkgdown_2.2.1 pillar_1.11.1 bslib_0.11.0
## [43] gtable_0.3.6 glue_1.8.1 systemfonts_1.3.2
## [46] xfun_0.60 tibble_3.3.1 tidyselect_1.2.1
## [49] knitr_1.51 farver_2.1.2 htmltools_0.5.9
## [52] rmarkdown_2.31 compiler_4.6.1 S7_0.2.2References
- Planey, Butte. Database integration of 4923 publicly-available samples of breast cancer molecular and clinical data. AMIA Joint Summits Translational Science Proceedings. (2003) PMC3814460
- Github repo with code, further documentation on datasets and baseline normalization schemes, and database quality checks: https://github.com/kplaney/curatedBreastCancer