Examples with a single annotation
Source:vignettes/articles/smaller_example.Rmd
smaller_example.RmdCreate input tree and matrix
In this case, assigng a probability of 1 to A–TRUE and 0 to A–FALSE for the t1 tip.
set.seed(1234)
randomTree <- rtree(7, rooted = TRUE)

mat <- matrix(
    data = rep(0.5, Ntip(randomTree) * 2), ncol = 2, dimnames = list(
        rownames = paste0('t', 1:Ntip(randomTree)), colnames = c('A--TRUE', 'A--FALSE')
    )
)
annotated_tips <- c('t3', 't2')
for (i in seq_along(randomTree$tip.label)) {
    if (randomTree$tip.label[i] %in% annotated_tips) {
        mat[randomTree$tip.label[i], ] <- c(1, 0)
    } else {
        mat[randomTree$tip.label[i], ] <- c(0, 1)
    }
}
mat
#>         colnames
#> rownames A--TRUE A--FALSE
#>       t1       0        1
#>       t2       1        0
#>       t3       1        0
#>       t4       0        1
#>       t5       0        1
#>       t6       0        1
#>       t7       0        1
Function for plotting
plotT <- function(tree, ace, input_tips, model = '', pi = '') {
    model <- dplyr::case_when(
        model == 'ER' ~ 'equal rates',
        model == 'ARD' ~ 'all rates different',
        model == 'SYM' ~ 'symmetrical rates'
    )

    title <- paste0(
        'Model transition rates: ', model,
        '\nRoot prior: ', pi
    )
    df <- as.data.frame(ace$ace)
    knownNode <- which(rownames(df) %in% input_tips)
    df$nodetip <- as.character(1:nrow(df))
    pieList <- vector('list', nrow(df))
    for (i in seq_along(pieList)) {
        names(pieList)[i] <- i
        dat <- reshape2::melt(df[i,], id.vars = 'nodetip')
        colnames(dat)[which(colnames(dat) == 'variable')] <- 'state'
        pieList[[i]] <- ggplot(dat, aes(y = value, fill = state, x="")) +
            geom_col() +
            coord_polar("y", start=0) +
            theme_void()
    }
    leg1 <- gtable_filter(ggplot_gtable(ggplot_build(pieList[[1]])), "guide-box")
    pieList <- lapply(pieList, function(x) x + theme(legend.position = 'none'))
    p <- ggtree(tree) +
        geom_highlight(node = knownNode, fill = "steelblue", alpha = 0.5) +
        geom_inset(insets = pieList, width = 0.1, height = 0.1) +
        geom_tiplab(offset = 0.05) +
        labs(title = title) +
        annotation_custom(grob = leg1, xmin = 1, xmax = 2, ymin = 1, ymax = 1)
    p
}
Run ASR for different models and prior root probabilities
models <- c('ER', 'ARD', 'SYM')
pis <- c('fitzjohn', 'equal', 'estimated')
plotList <- vector('list', length(models) * length(pis))
n <- 1
for (i in seq_along(models)) {
    for (j in seq_along(pis)) {
        fit <- fitMk(tree = randomTree, x = mat, model = models[i], pi = pis[j])
        ace <- ancr(fit, tips = TRUE)
        plotList[[n]] <- plotT(
            randomTree, ace = ace, input_tips = annotated_tips,
            model = models[i], pi = pis[j]
        )
        n <- n + 1
    }
}
#> Using pi estimated from the stationary distribution of Q assuming a flat prior.
#> pi =
#>  A--TRUE A--FALSE
#>      0.5      0.5
#>
#> Using pi estimated from the stationary distribution of Q assuming a flat prior.
#> pi =
#>  A--TRUE A--FALSE
#> 0.253468 0.746532
#>
#> Using pi estimated from the stationary distribution of Q assuming a flat prior.
#> pi =
#>  A--TRUE A--FALSE
#>      0.5      0.5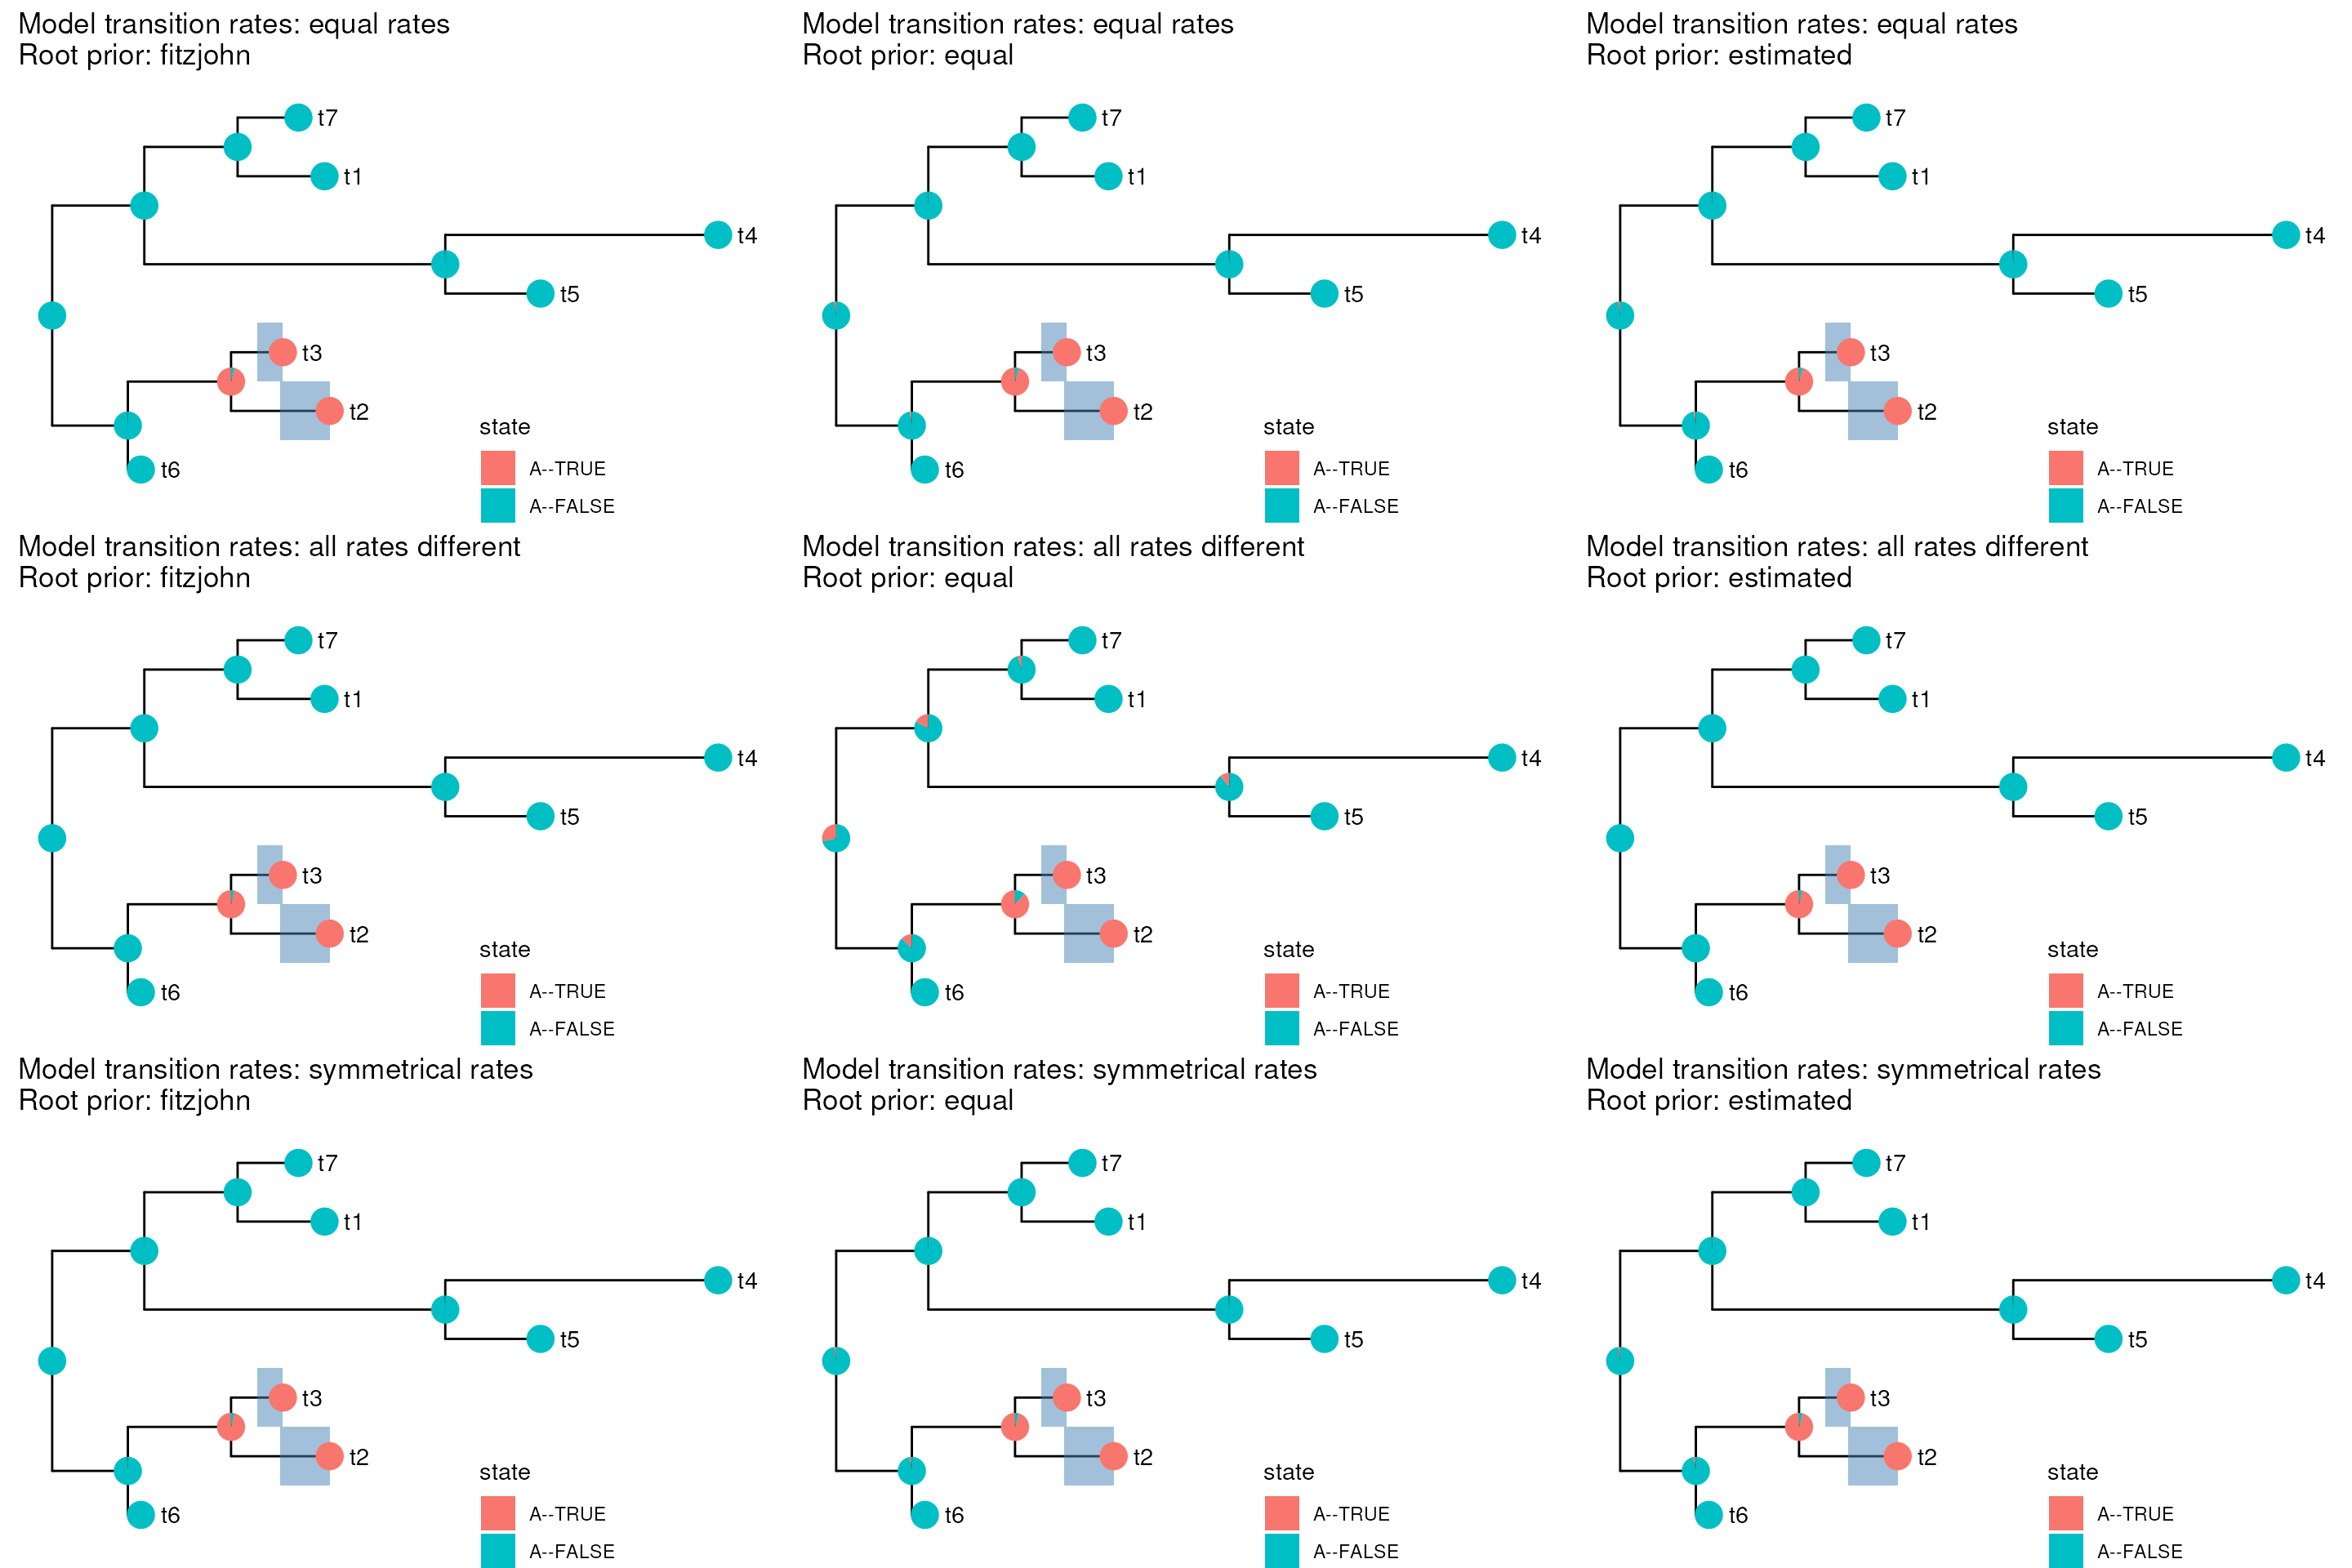
Examle 2
annotated_tips <- c('t1', 't5')
for (i in seq_along(randomTree$tip.label)) {
if (randomTree$tip.label[i] %in% annotated_tips) {
mat[randomTree$tip.label[i], ] <- c(1, 0)
} else {
mat[randomTree$tip.label[i], ] <- c(0, 1)
}
}
models <- c('ER', 'ARD', 'SYM')
pis <- c('fitzjohn', 'equal', 'estimated')
plotList <- vector('list', length(models) * length(pis))
n <- 1
for (i in seq_along(models)) {
for (j in seq_along(pis)) {
fit <- fitMk(tree = randomTree, x = mat, model = models[i], pi = pis[j])
ace <- ancr(fit, tips = TRUE)
plotList[[n]] <- plotT(
randomTree, ace = ace, input_tips = annotated_tips,
model = models[i], pi = pis[j]
)
n <- n + 1
}
}
#> Using pi estimated from the stationary distribution of Q assuming a flat prior.
#> pi =
#> A--TRUE A--FALSE
#> 0.5 0.5
#>
#> Using pi estimated from the stationary distribution of Q assuming a flat prior.
#> pi =
#> A--TRUE A--FALSE
#> 0.285714 0.714286
#>
#> Using pi estimated from the stationary distribution of Q assuming a flat prior.
#> pi =
#> A--TRUE A--FALSE
#> 0.5 0.5
mergedPlot <- ggarrange(plotlist = plotList, ncol = 3, nrow = 3)
mergedPlot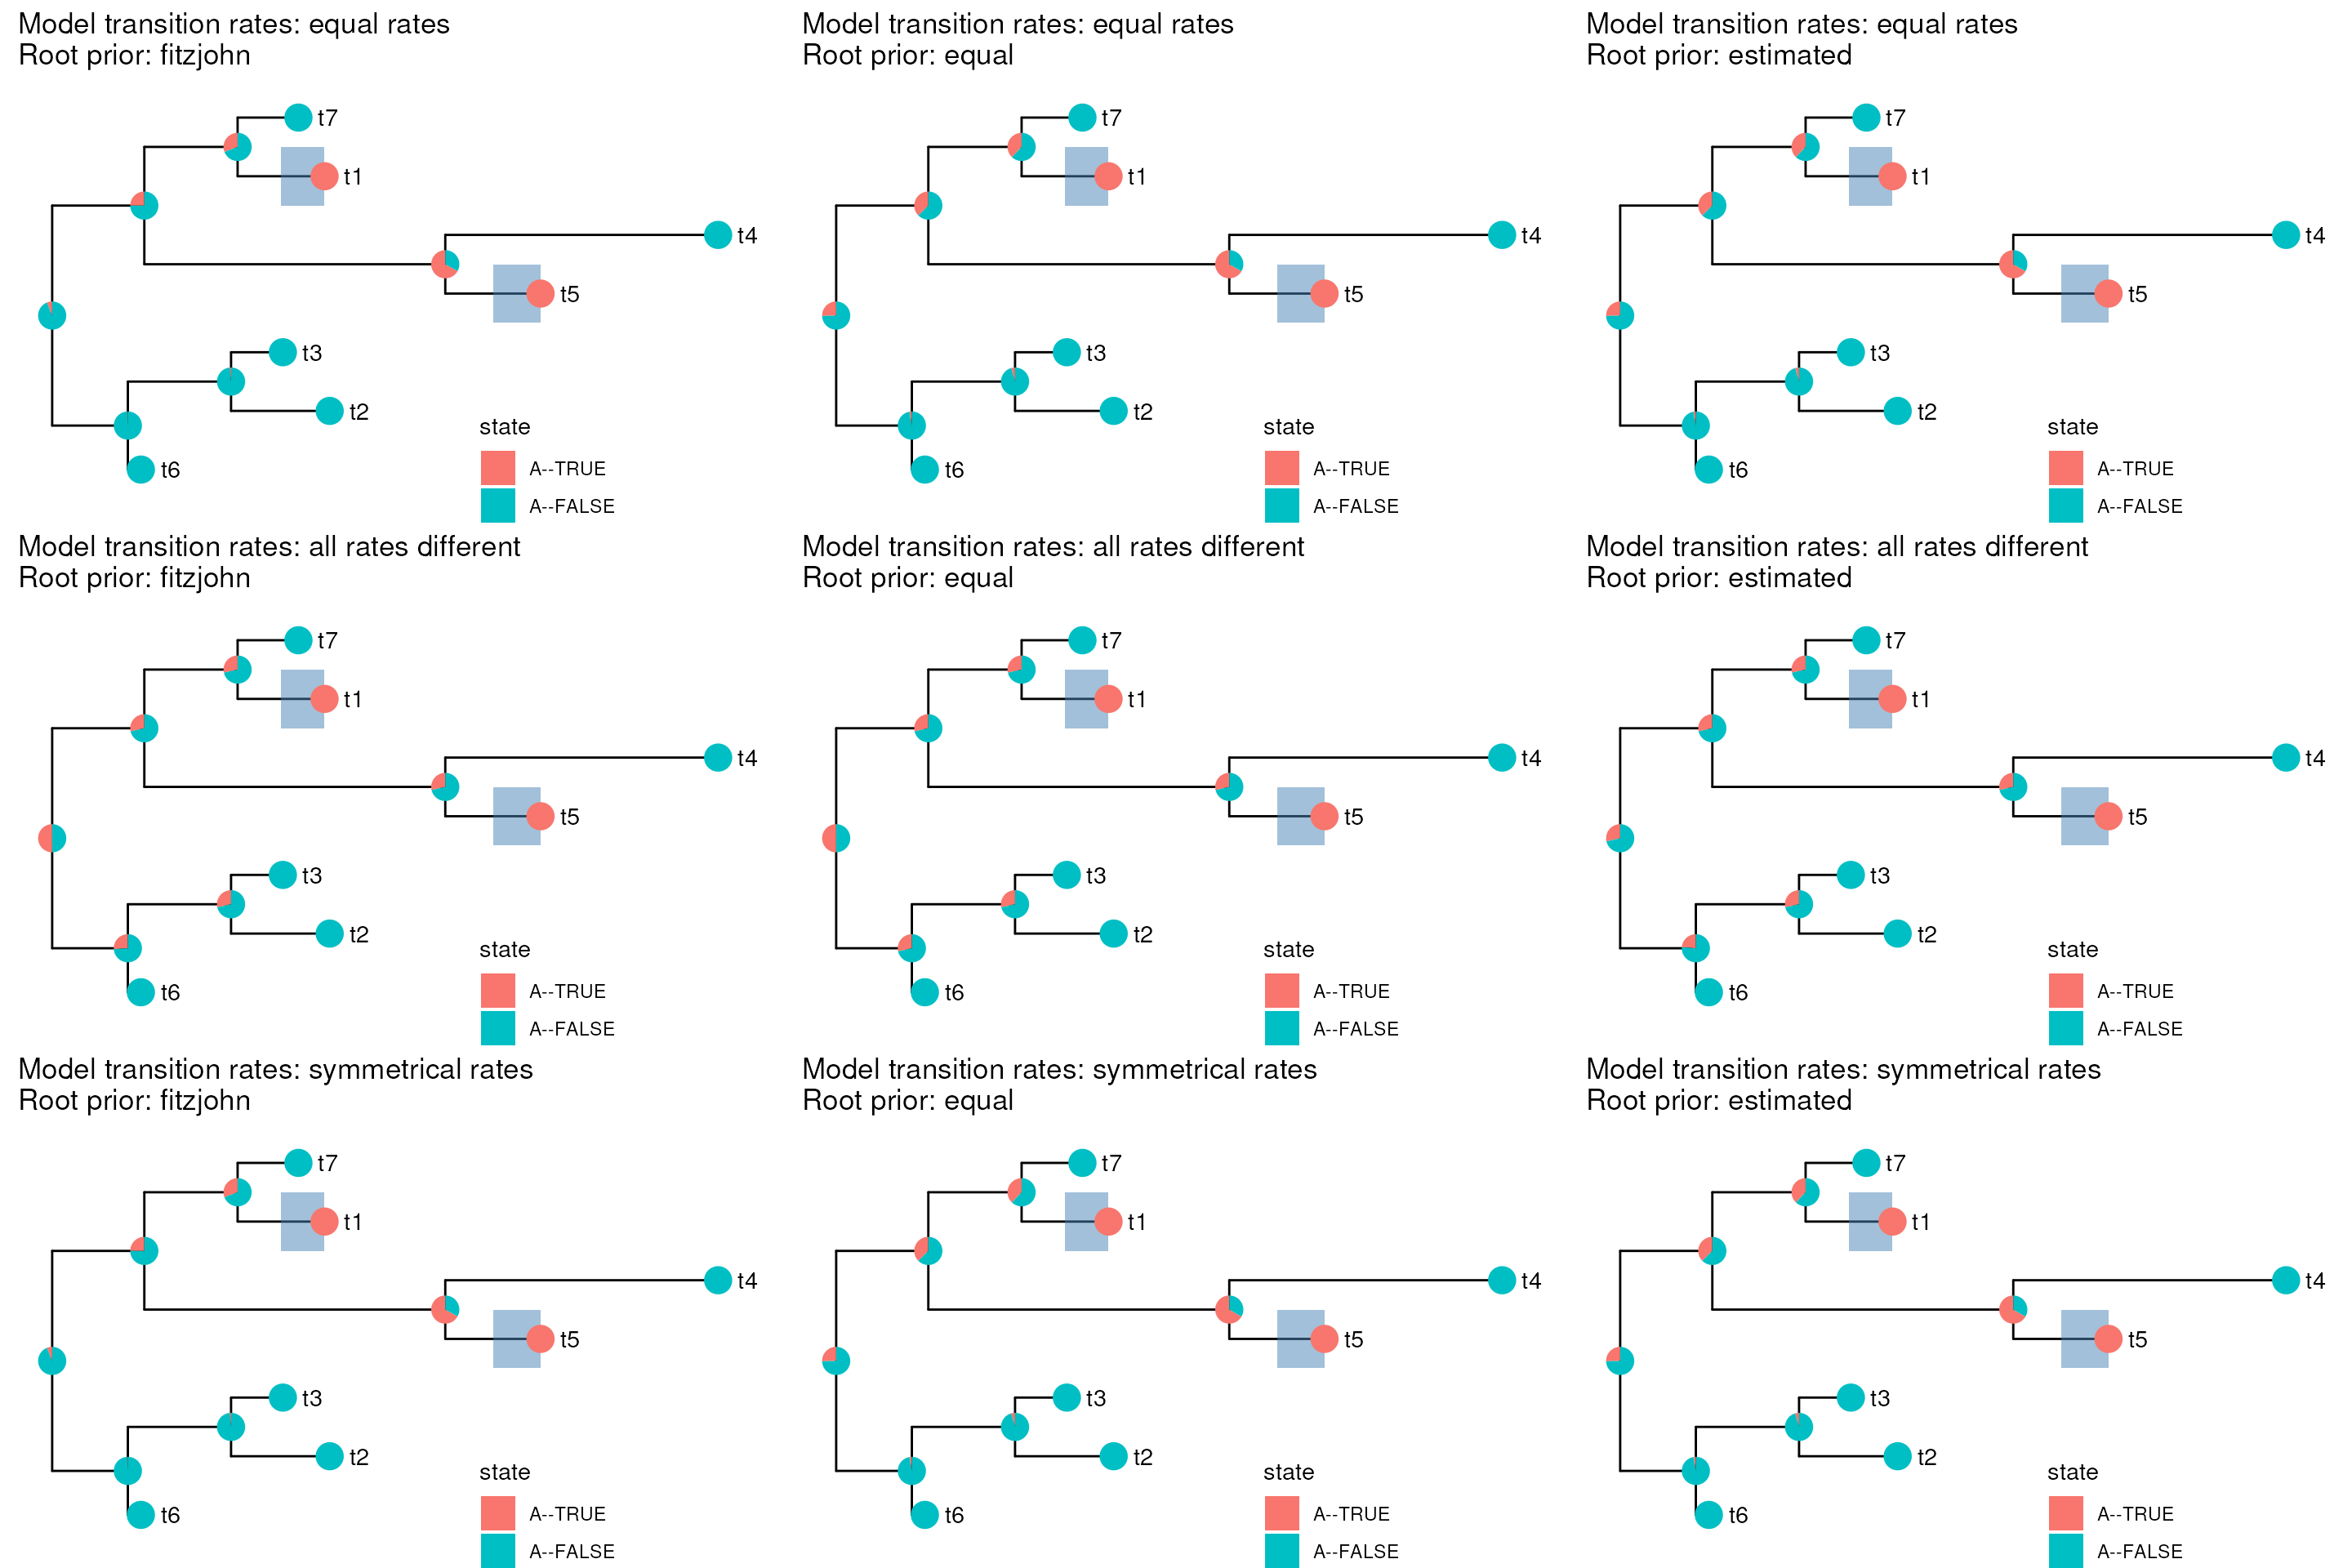
mat <- matrix(
    data = rep(0.5, Ntip(randomTree) * 2), ncol = 2, dimnames = list(
        rownames = paste0('t', 1:Ntip(randomTree)), colnames = c('A--TRUE', 'A--FALSE')
    )
)
annotated_tips <- c('t3', 't2')
for (i in seq_along(randomTree$tip.label)) {
    if (randomTree$tip.label[i] %in% annotated_tips) {
        mat[randomTree$tip.label[i], ] <- c(1, 0)
    }
}
mat
#>         colnames
#> rownames A--TRUE A--FALSE
#>       t1     0.5      0.5
#>       t2     1.0      0.0
#>       t3     1.0      0.0
#>       t4     0.5      0.5
#>       t5     0.5      0.5
#>       t6     0.5      0.5
#>       t7     0.5      0.5
models <- c('ER', 'ARD', 'SYM')
pis <- c('fitzjohn', 'equal', 'estimated')
plotList <- vector('list', length(models) * length(pis))
n <- 1
for (i in seq_along(models)) {
    for (j in seq_along(pis)) {
        fit <- fitMk(tree = randomTree, x = mat, model = models[i], pi = pis[j])
        ace <- ancr(fit, tips = TRUE)
        plotList[[n]] <- plotT(
            randomTree, ace = ace, input_tips = annotated_tips,
            model = models[i], pi = pis[j]
        )
        n <- n + 1
    }
}
#> Using pi estimated from the stationary distribution of Q assuming a flat prior.
#> pi =
#>  A--TRUE A--FALSE
#> 0.999934 0.000066
#>
#> Using pi estimated from the stationary distribution of Q assuming a flat prior.
#> pi =
#>  A--TRUE A--FALSE
#> 0.999934 0.000066
#>
#> Using pi estimated from the stationary distribution of Q assuming a flat prior.
#> pi =
#>  A--TRUE A--FALSE
#> 0.999934 0.000066
mergedPlot <- ggarrange(plotlist = plotList, ncol = 3, nrow = 3)
mergedPlot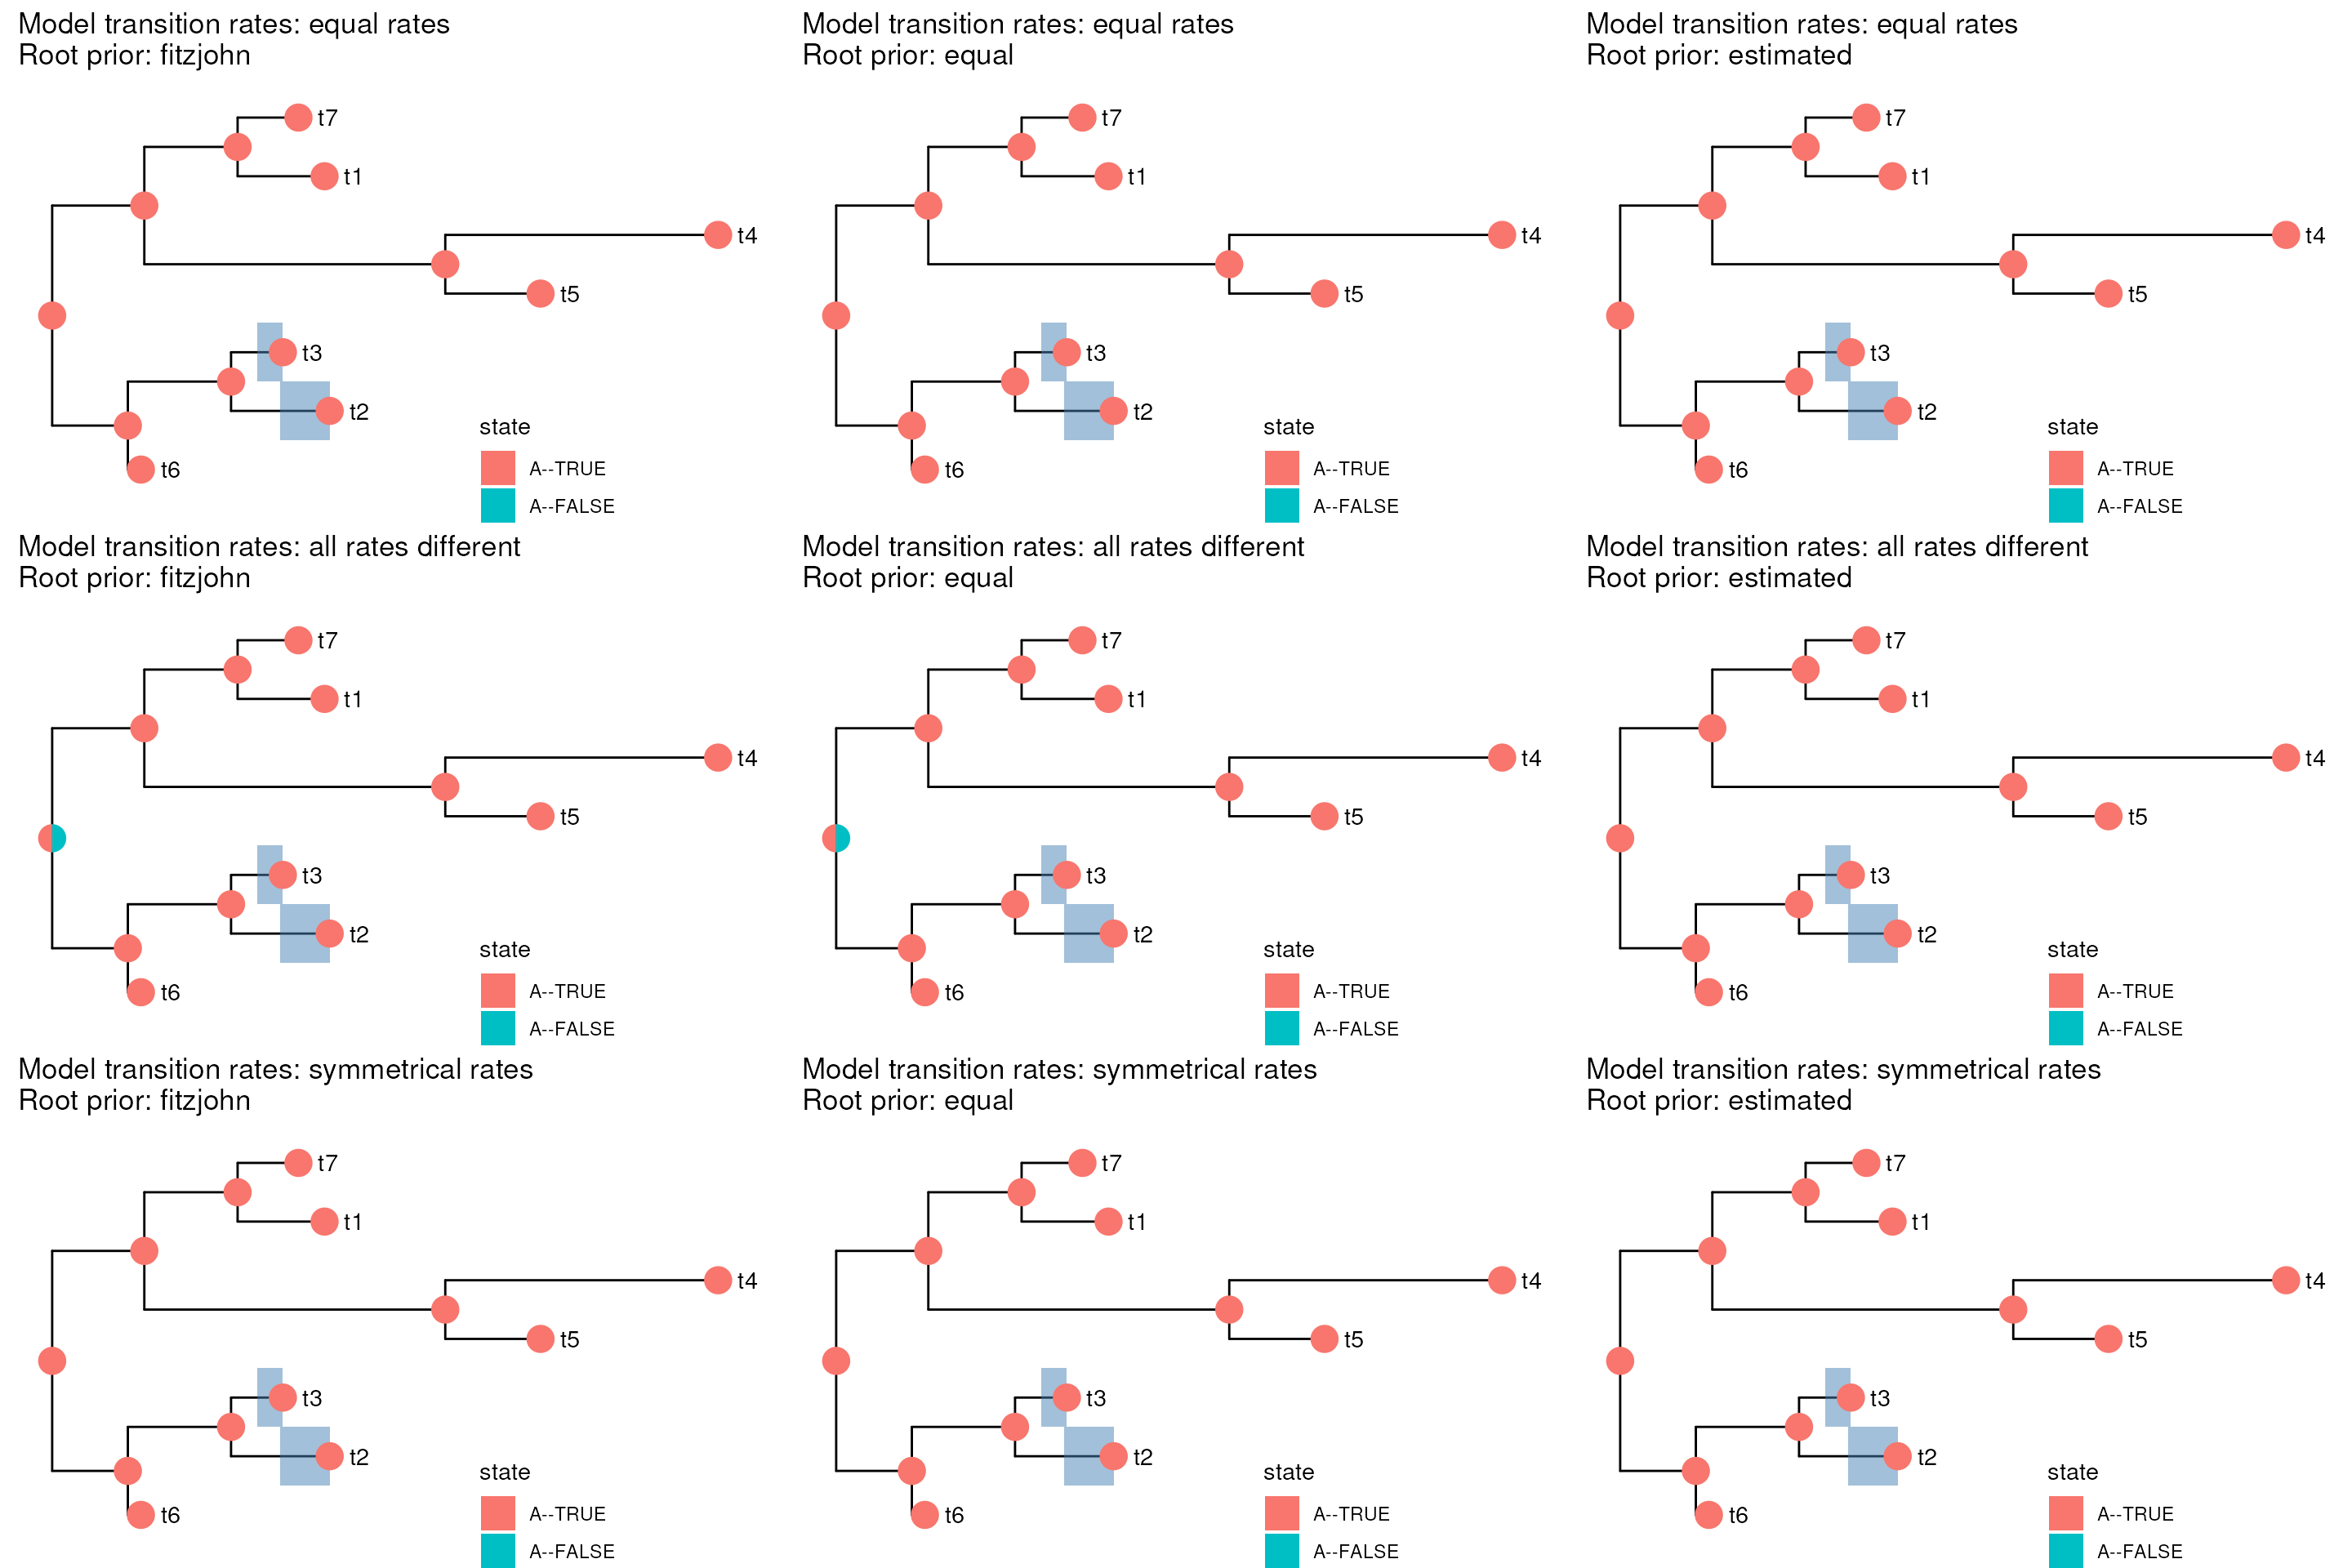
mat <- matrix(
    data = rep(0.5, Ntip(randomTree) * 2), ncol = 2, dimnames = list(
        rownames = paste0('t', 1:Ntip(randomTree)), colnames = c('A--TRUE', 'A--FALSE')
    )
)
annotated_tips <- c('t1', 't5')
for (i in seq_along(randomTree$tip.label)) {
    if (randomTree$tip.label[i] %in% annotated_tips) {
        mat[randomTree$tip.label[i], ] <- c(1, 0)
    }
}
mat
#>         colnames
#> rownames A--TRUE A--FALSE
#>       t1     1.0      0.0
#>       t2     0.5      0.5
#>       t3     0.5      0.5
#>       t4     0.5      0.5
#>       t5     1.0      0.0
#>       t6     0.5      0.5
#>       t7     0.5      0.5
models <- c('ER', 'ARD', 'SYM')
pis <- c('fitzjohn', 'equal', 'estimated')
plotList <- vector('list', length(models) * length(pis))
n <- 1
for (i in seq_along(models)) {
    for (j in seq_along(pis)) {
        fit <- fitMk(tree = randomTree, x = mat, model = models[i], pi = pis[j])
        ace <- ancr(fit, tips = TRUE)
        plotList[[n]] <- plotT(
            randomTree, ace = ace, input_tips = annotated_tips,
            model = models[i], pi = pis[j]
        )
        n <- n + 1
    }
}
#> Using pi estimated from the stationary distribution of Q assuming a flat prior.
#> pi =
#>  A--TRUE A--FALSE
#> 0.999934 0.000066
#>
#> Using pi estimated from the stationary distribution of Q assuming a flat prior.
#> pi =
#>  A--TRUE A--FALSE
#> 0.999934 0.000066
#>
#> Using pi estimated from the stationary distribution of Q assuming a flat prior.
#> pi =
#>  A--TRUE A--FALSE
#> 0.999934 0.000066
mergedPlot <- ggarrange(plotlist = plotList, ncol = 3, nrow = 3)
mergedPlot
Example 3
mat <- matrix(
    data = rep(0.5, Ntip(randomTree) * 2), ncol = 2, dimnames = list(
        rownames = paste0('t', 1:Ntip(randomTree)), colnames = c('A--TRUE', 'A--FALSE')
    )
)
annotated_tips <- c('t1', 't5')
for (i in seq_along(randomTree$tip.label)) {
    if (randomTree$tip.label[i] %in% annotated_tips) {
        mat[randomTree$tip.label[i], ] <- c(1, 0)
    } else {
        mat[randomTree$tip.label[i], ] <- c(0, 1)
    }
}
mat["t4",] <- c(0.5, 0.5)
mat["t7",] <- c(0.5, 0.5)
mat["t2",] <- c(0.5, 0.5)
mat
#>         colnames
#> rownames A--TRUE A--FALSE
#>       t1     1.0      0.0
#>       t2     0.5      0.5
#>       t3     0.0      1.0
#>       t4     0.5      0.5
#>       t5     1.0      0.0
#>       t6     0.0      1.0
#>       t7     0.5      0.5
models <- c('ER', 'ARD', 'SYM')
pis <- c('fitzjohn', 'equal', 'estimated')
plotList <- vector('list', length(models) * length(pis))
n <- 1
for (i in seq_along(models)) {
    for (j in seq_along(pis)) {
        fit <- fitMk(tree = randomTree, x = mat, model = models[i], pi = pis[j])
        ace <- ancr(fit, tips = TRUE)
        plotList[[n]] <- plotT(
            randomTree, ace = ace, input_tips = c("t1", "t5", "t3", "t6"),
            model = models[i], pi = pis[j]
        )
        n <- n + 1
    }
}
#> Using pi estimated from the stationary distribution of Q assuming a flat prior.
#> pi =
#>  A--TRUE A--FALSE
#>      0.5      0.5
#>
#> Using pi estimated from the stationary distribution of Q assuming a flat prior.
#> pi =
#>  A--TRUE A--FALSE
#> 0.999934 0.000066
#>
#> Using pi estimated from the stationary distribution of Q assuming a flat prior.
#> pi =
#>  A--TRUE A--FALSE
#>      0.5      0.5
mergedPlot <- ggarrange(plotlist = plotList, ncol = 3, nrow = 3)
mergedPlot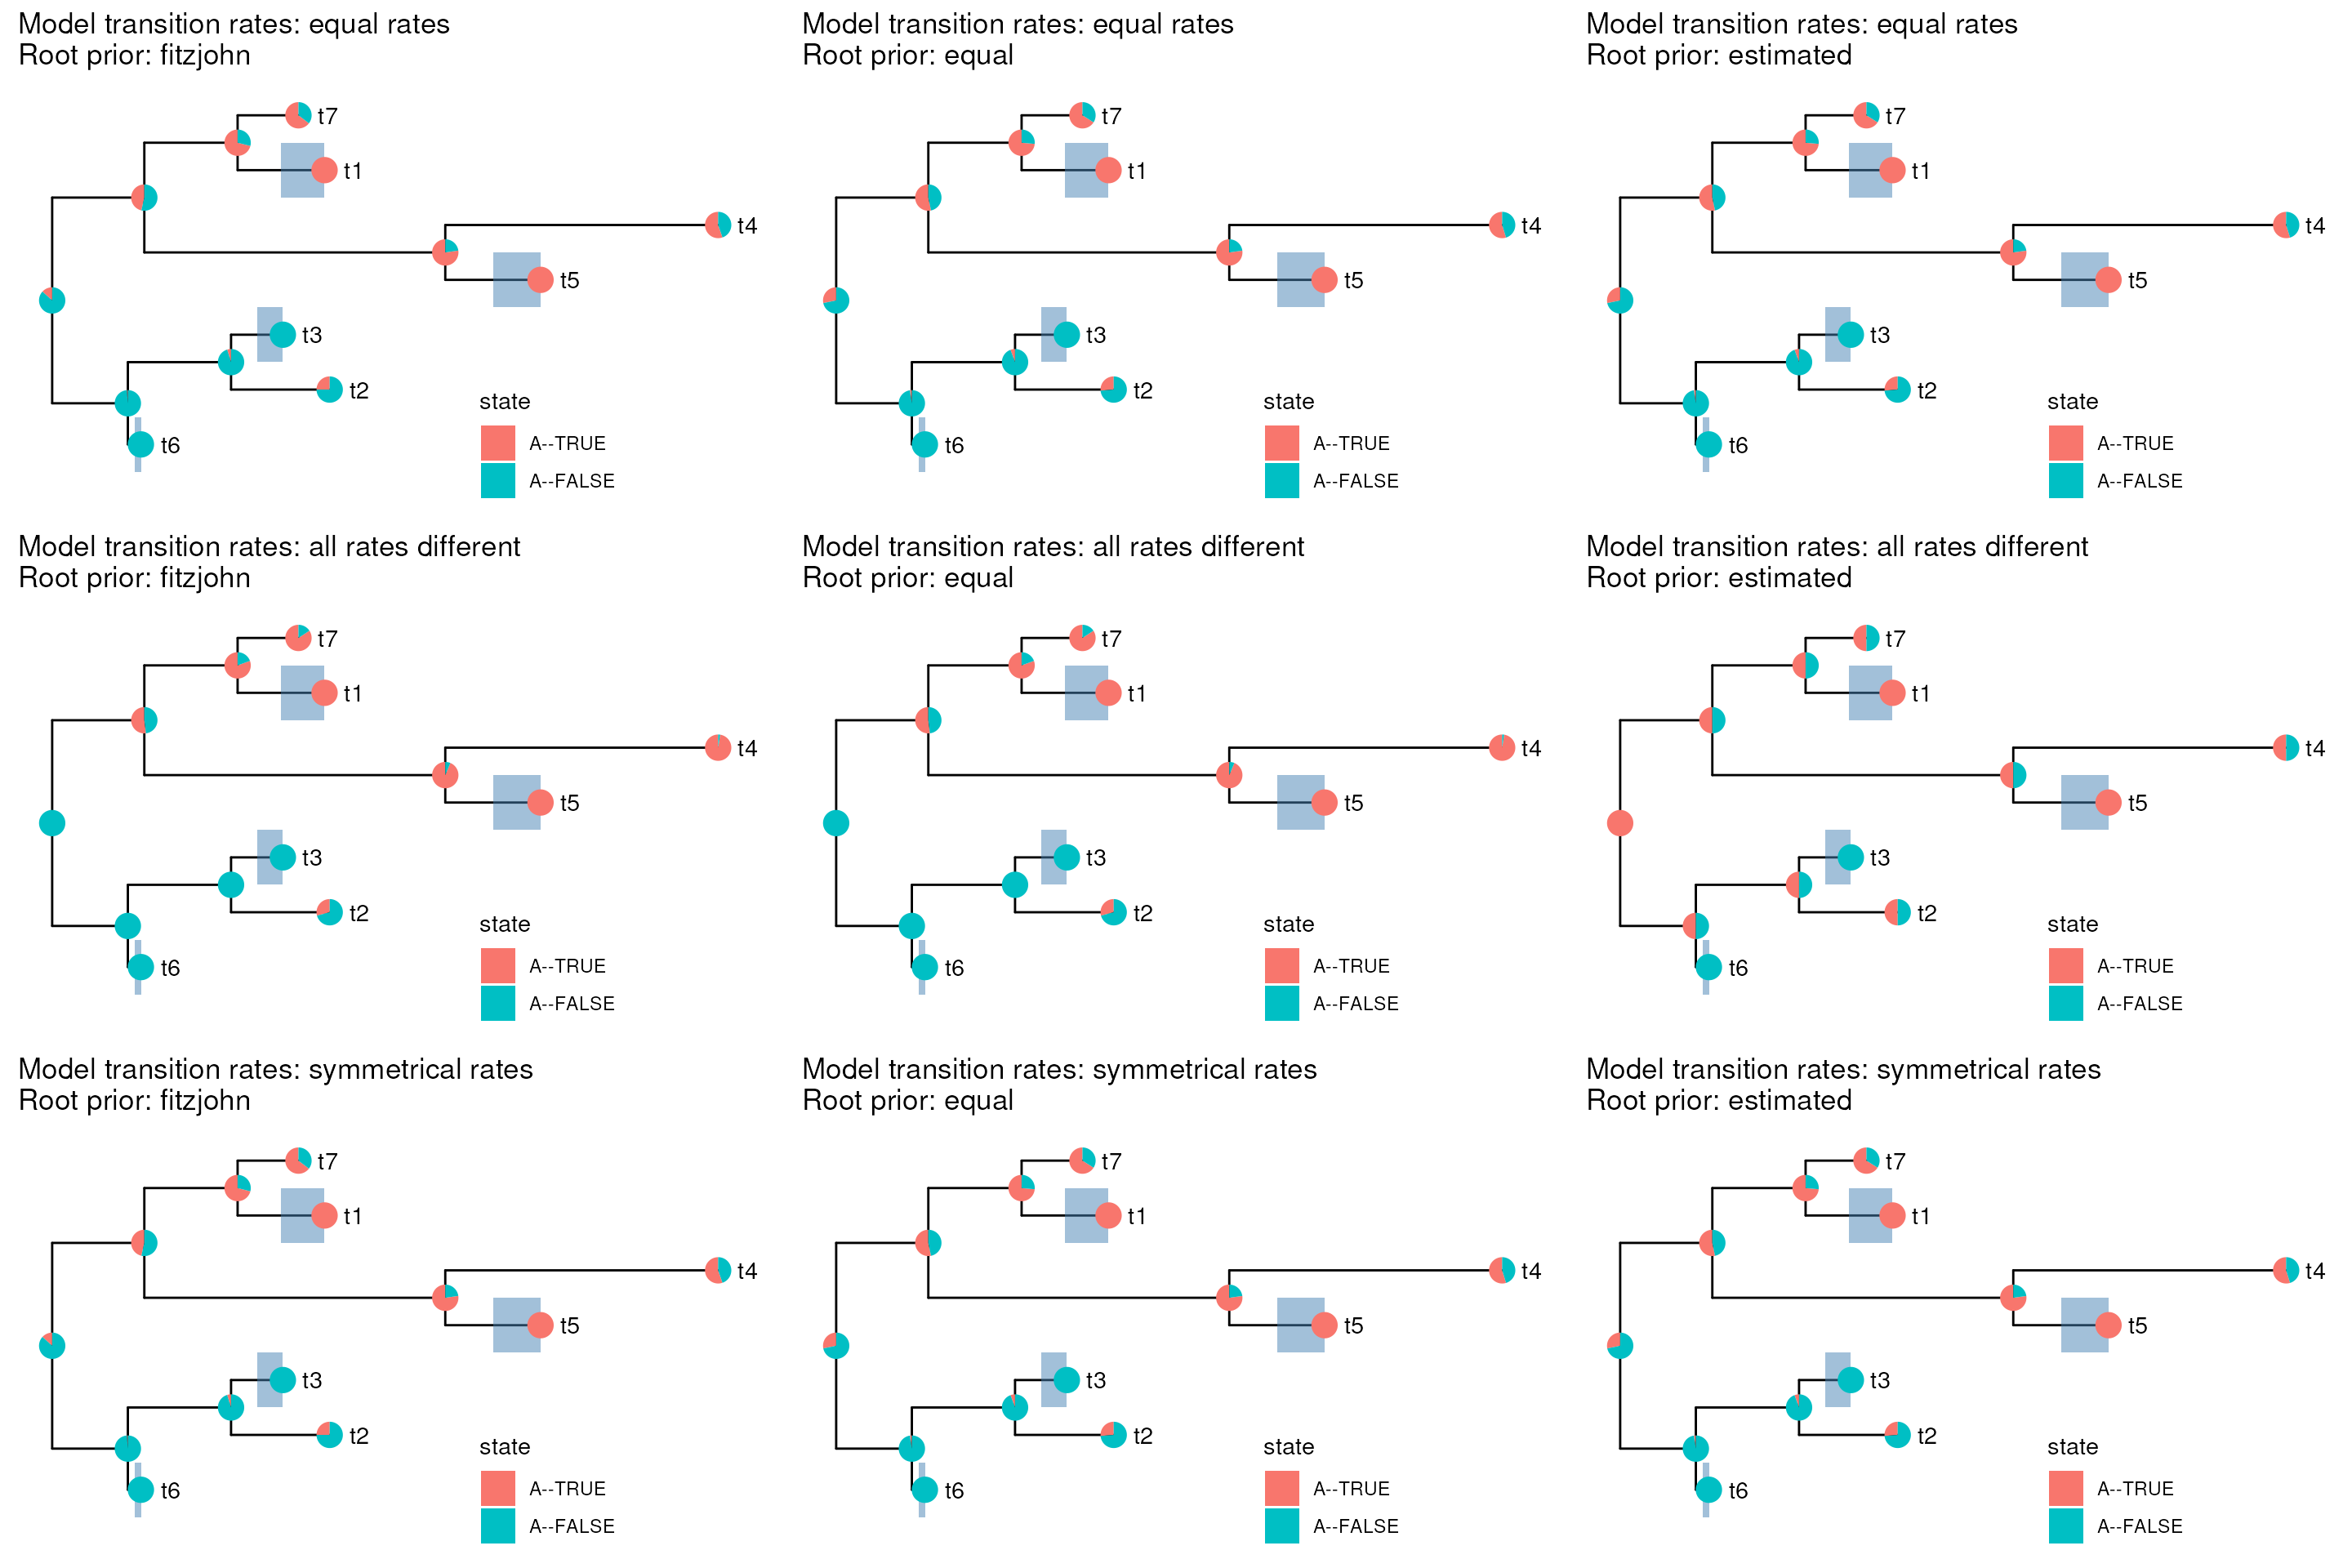
Session info
sessioninfo::session_info()
#> ─ Session info ───────────────────────────────────────────────────────────────
#>  setting  value
#>  version  R version 4.4.1 (2024-06-14)
#>  os       Ubuntu 22.04.4 LTS
#>  system   x86_64, linux-gnu
#>  ui       X11
#>  language en
#>  collate  en_US.UTF-8
#>  ctype    en_US.UTF-8
#>  tz       Etc/UTC
#>  date     2025-06-30
#>  pandoc   3.2 @ /usr/bin/ (via rmarkdown)
#>  quarto   1.4.555 @ /usr/local/bin/quarto
#>
#> ─ Packages ───────────────────────────────────────────────────────────────────
#>  package           * version    date (UTC) lib source
#>  abind               1.4-8      2024-09-12 [1] RSPM (R 4.4.0)
#>  ape               * 5.8-1      2024-12-16 [1] RSPM (R 4.4.0)
#>  aplot               0.2.7      2025-06-21 [1] RSPM (R 4.4.0)
#>  backports           1.5.0      2024-05-23 [1] RSPM (R 4.4.0)
#>  broom               1.0.8      2025-03-28 [1] RSPM (R 4.4.0)
#>  bslib               0.9.0      2025-01-30 [1] RSPM (R 4.4.0)
#>  cachem              1.1.0      2024-05-16 [1] RSPM (R 4.4.0)
#>  car                 3.1-3      2024-09-27 [1] RSPM (R 4.4.0)
#>  carData             3.0-5      2022-01-06 [1] RSPM (R 4.4.0)
#>  cli                 3.6.5      2025-04-23 [1] RSPM (R 4.4.0)
#>  clusterGeneration   1.3.8      2023-08-16 [1] RSPM (R 4.4.0)
#>  coda                0.19-4.1   2024-01-31 [1] RSPM (R 4.4.0)
#>  codetools           0.2-20     2024-03-31 [2] CRAN (R 4.4.1)
#>  combinat            0.0-8      2012-10-29 [1] RSPM (R 4.4.0)
#>  cowplot             1.1.3      2024-01-22 [1] RSPM (R 4.4.0)
#>  DEoptim             2.2-8      2022-11-11 [1] RSPM (R 4.4.0)
#>  desc                1.4.3      2023-12-10 [1] RSPM (R 4.4.0)
#>  digest              0.6.37     2024-08-19 [1] RSPM (R 4.4.0)
#>  doParallel          1.0.17     2022-02-07 [1] RSPM (R 4.4.0)
#>  dplyr               1.1.4      2023-11-17 [1] RSPM (R 4.4.0)
#>  evaluate            1.0.4      2025-06-18 [1] RSPM (R 4.4.0)
#>  expm                1.0-0      2024-08-19 [1] RSPM (R 4.4.0)
#>  farver              2.1.2      2024-05-13 [1] RSPM (R 4.4.0)
#>  fastmap             1.2.0      2024-05-15 [1] RSPM (R 4.4.0)
#>  fastmatch           1.1-6      2024-12-23 [1] RSPM (R 4.4.0)
#>  foreach             1.5.2      2022-02-02 [1] RSPM (R 4.4.0)
#>  Formula             1.2-5      2023-02-24 [1] RSPM (R 4.4.0)
#>  fs                  1.6.6      2025-04-12 [1] RSPM (R 4.4.0)
#>  generics            0.1.4      2025-05-09 [1] RSPM (R 4.4.0)
#>  ggfun               0.1.9      2025-06-21 [1] RSPM (R 4.4.0)
#>  ggimage             0.3.3      2023-06-19 [1] RSPM (R 4.4.0)
#>  ggplot2           * 3.5.2      2025-04-09 [1] RSPM (R 4.4.0)
#>  ggplotify           0.1.2      2023-08-09 [1] RSPM (R 4.4.0)
#>  ggpubr            * 0.6.1      2025-06-27 [1] RSPM (R 4.4.0)
#>  ggsignif            0.6.4      2022-10-13 [1] RSPM (R 4.4.0)
#>  ggtree            * 3.12.0     2024-04-30 [1] Bioconductor 3.19 (R 4.4.1)
#>  glue                1.8.0      2024-09-30 [1] RSPM (R 4.4.0)
#>  gridGraphics        0.5-1      2020-12-13 [1] RSPM (R 4.4.0)
#>  gtable            * 0.3.6      2024-10-25 [1] RSPM (R 4.4.0)
#>  htmltools           0.5.8.1    2024-04-04 [1] RSPM (R 4.4.0)
#>  htmlwidgets         1.6.4      2023-12-06 [1] RSPM (R 4.4.0)
#>  igraph              2.1.4      2025-01-23 [1] RSPM (R 4.4.0)
#>  iterators           1.0.14     2022-02-05 [1] RSPM (R 4.4.0)
#>  jquerylib           0.1.4      2021-04-26 [1] RSPM (R 4.4.0)
#>  jsonlite            2.0.0      2025-03-27 [1] RSPM (R 4.4.0)
#>  knitr               1.50       2025-03-16 [1] RSPM (R 4.4.0)
#>  labeling            0.4.3      2023-08-29 [1] RSPM (R 4.4.0)
#>  lattice             0.22-6     2024-03-20 [2] CRAN (R 4.4.1)
#>  lazyeval            0.2.2      2019-03-15 [1] RSPM (R 4.4.0)
#>  lifecycle           1.0.4      2023-11-07 [1] RSPM (R 4.4.0)
#>  magick              2.8.7      2025-06-06 [1] RSPM (R 4.4.0)
#>  magrittr            2.0.3      2022-03-30 [1] RSPM (R 4.4.0)
#>  maps              * 3.4.3      2025-05-26 [1] RSPM (R 4.4.0)
#>  MASS                7.3-61     2024-06-13 [2] RSPM (R 4.4.0)
#>  Matrix              1.7-0      2024-04-26 [2] CRAN (R 4.4.1)
#>  mnormt              2.1.1      2022-09-26 [1] RSPM (R 4.4.0)
#>  nlme                3.1-165    2024-06-06 [2] RSPM (R 4.4.0)
#>  numDeriv            2016.8-1.1 2019-06-06 [1] RSPM (R 4.4.0)
#>  optimParallel       1.0-2      2021-02-11 [1] RSPM (R 4.4.0)
#>  patchwork           1.3.1      2025-06-21 [1] RSPM (R 4.4.0)
#>  phangorn            2.12.1     2024-09-17 [1] RSPM (R 4.4.0)
#>  phytools          * 2.4-4      2025-01-08 [1] RSPM (R 4.4.0)
#>  pillar              1.10.2     2025-04-05 [1] RSPM (R 4.4.0)
#>  pkgconfig           2.0.3      2019-09-22 [1] RSPM (R 4.4.0)
#>  pkgdown             2.1.3      2025-05-25 [1] RSPM (R 4.4.0)
#>  plyr                1.8.9      2023-10-02 [1] RSPM (R 4.4.0)
#>  purrr               1.0.4      2025-02-05 [1] RSPM (R 4.4.0)
#>  quadprog            1.5-8      2019-11-20 [1] RSPM (R 4.4.0)
#>  R6                  2.6.1      2025-02-15 [1] RSPM (R 4.4.0)
#>  ragg                1.4.0      2025-04-10 [1] RSPM (R 4.4.0)
#>  RColorBrewer        1.1-3      2022-04-03 [1] RSPM (R 4.4.0)
#>  Rcpp                1.0.14     2025-01-12 [1] RSPM (R 4.4.0)
#>  reshape2            1.4.4      2020-04-09 [1] RSPM (R 4.4.0)
#>  rlang               1.1.6      2025-04-11 [1] RSPM (R 4.4.0)
#>  rmarkdown           2.29       2024-11-04 [1] RSPM (R 4.4.0)
#>  rstatix             0.7.2      2023-02-01 [1] RSPM (R 4.4.0)
#>  sass                0.4.10     2025-04-11 [1] RSPM (R 4.4.0)
#>  scales              1.4.0      2025-04-24 [1] RSPM (R 4.4.0)
#>  scatterplot3d       0.3-44     2023-05-05 [1] RSPM (R 4.4.0)
#>  sessioninfo         1.2.3      2025-02-05 [1] RSPM (R 4.4.0)
#>  stringi             1.8.7      2025-03-27 [1] RSPM (R 4.4.0)
#>  stringr             1.5.1      2023-11-14 [1] RSPM (R 4.4.0)
#>  systemfonts         1.1.0      2024-05-15 [1] RSPM (R 4.4.0)
#>  textshaping         0.4.0      2024-05-24 [1] RSPM (R 4.4.0)
#>  tibble              3.3.0      2025-06-08 [1] RSPM (R 4.4.0)
#>  tidyr               1.3.1      2024-01-24 [1] RSPM (R 4.4.0)
#>  tidyselect          1.2.1      2024-03-11 [1] RSPM (R 4.4.0)
#>  tidytree            0.4.6      2023-12-12 [1] RSPM (R 4.4.0)
#>  treeio              1.28.0     2024-04-30 [1] Bioconductor 3.19 (R 4.4.1)
#>  vctrs               0.6.5      2023-12-01 [1] RSPM (R 4.4.0)
#>  withr               3.0.2      2024-10-28 [1] RSPM (R 4.4.0)
#>  xfun                0.52       2025-04-02 [1] RSPM (R 4.4.0)
#>  yaml                2.3.10     2024-07-26 [1] RSPM (R 4.4.0)
#>  yulab.utils         0.2.0      2025-01-29 [1] RSPM (R 4.4.0)
#>
#>  [1] /usr/local/lib/R/site-library
#>  [2] /usr/local/lib/R/library
#>  * ── Packages attached to the search path.
#>
#> ──────────────────────────────────────────────────────────────────────────────