Applied Statistics for High-throughput Biology: Session 4
Levi Waldron
day4_batcheffects-vis.RmdOutline
- Directed acyclic graphs
-
Exploratory
data analysis (Chapter 2)
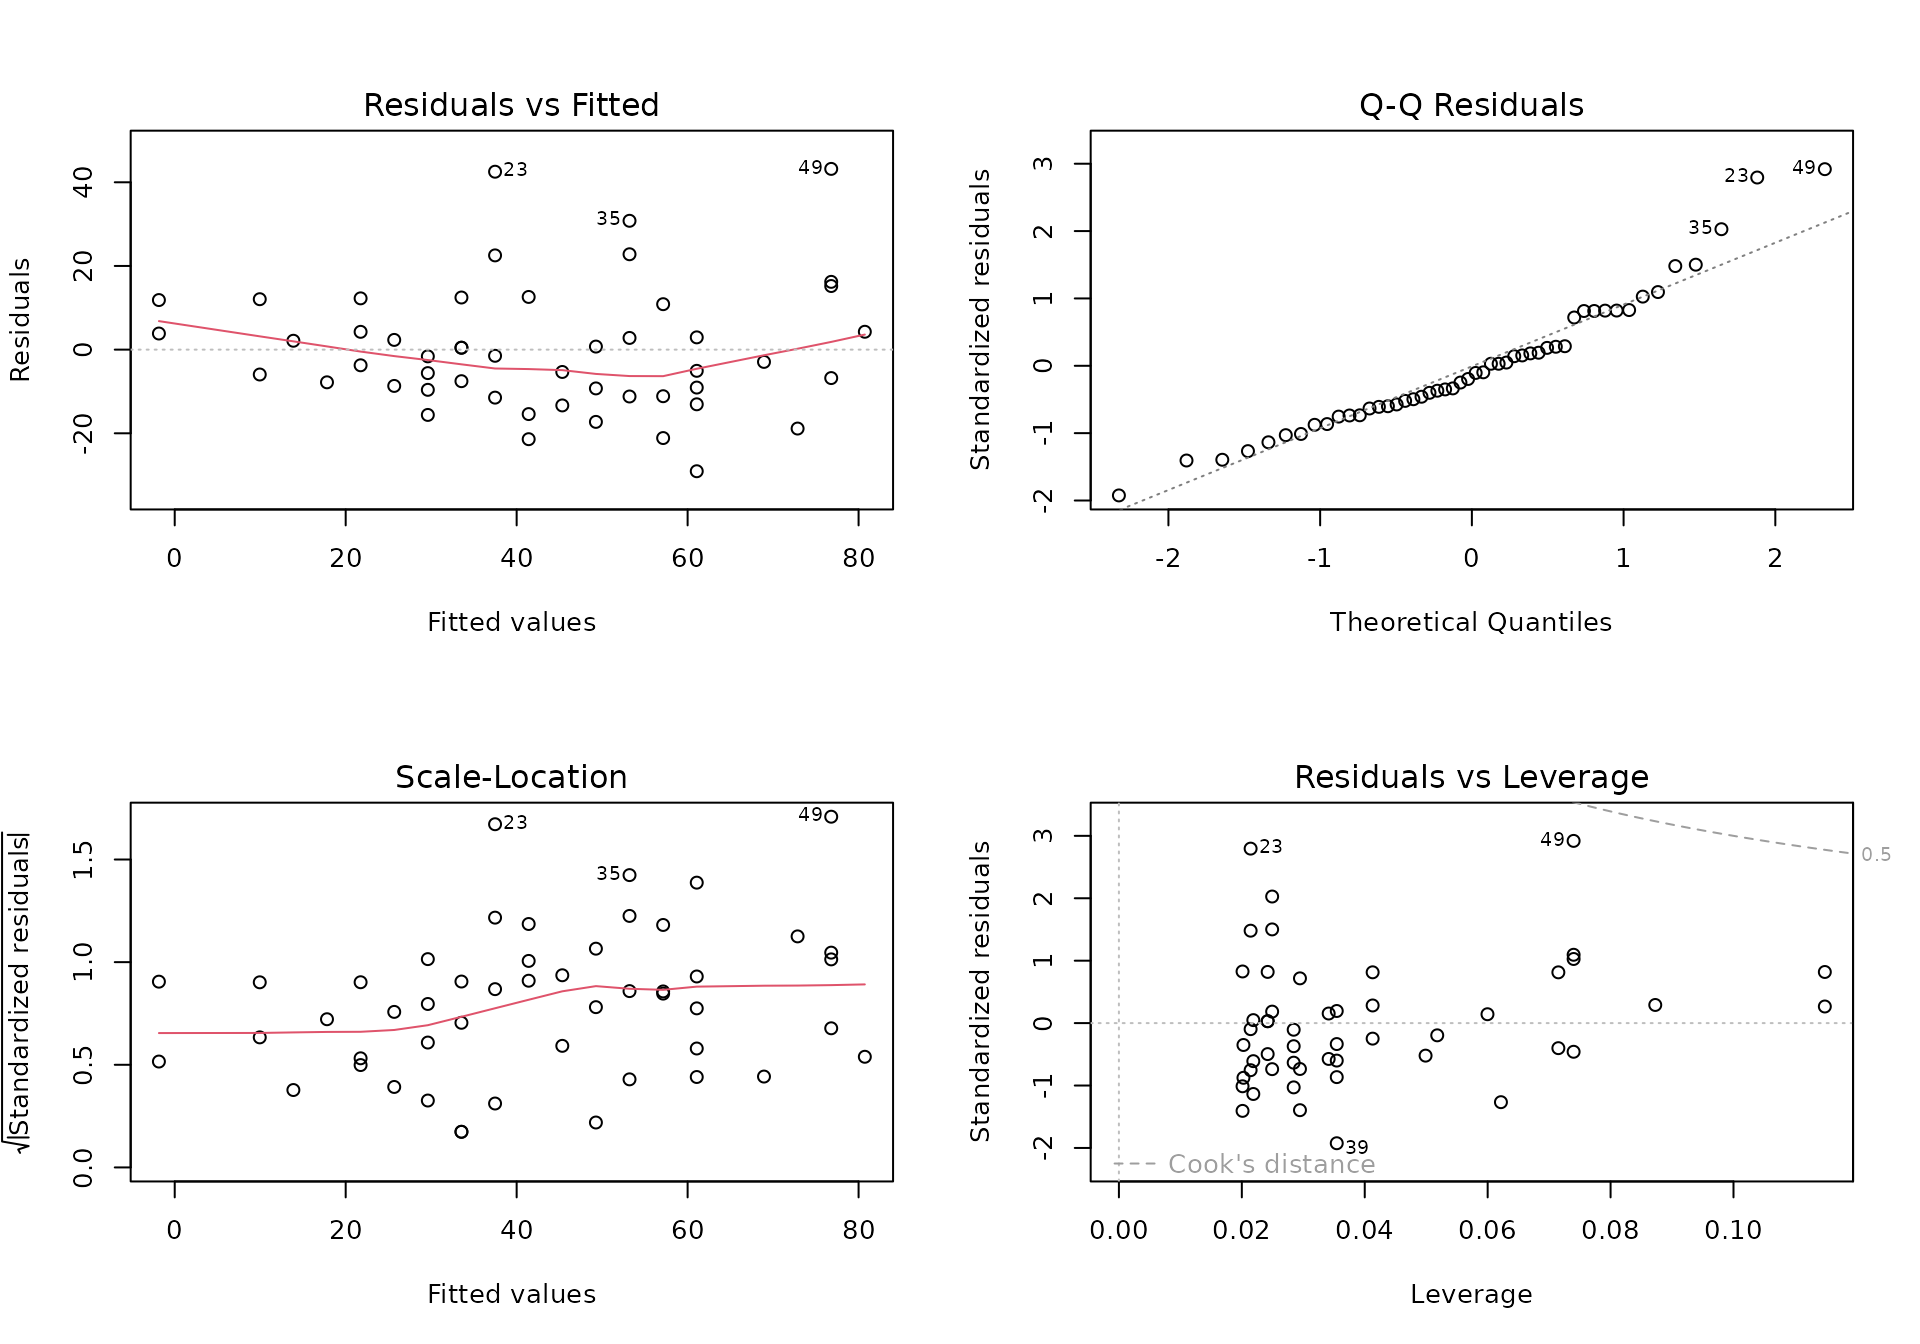
- Quantile Quantile (QQ)-plots and regression diagnostics
- Volcano plots
- MA plots
- heatmaps
- Batch effects (Chapter 10)
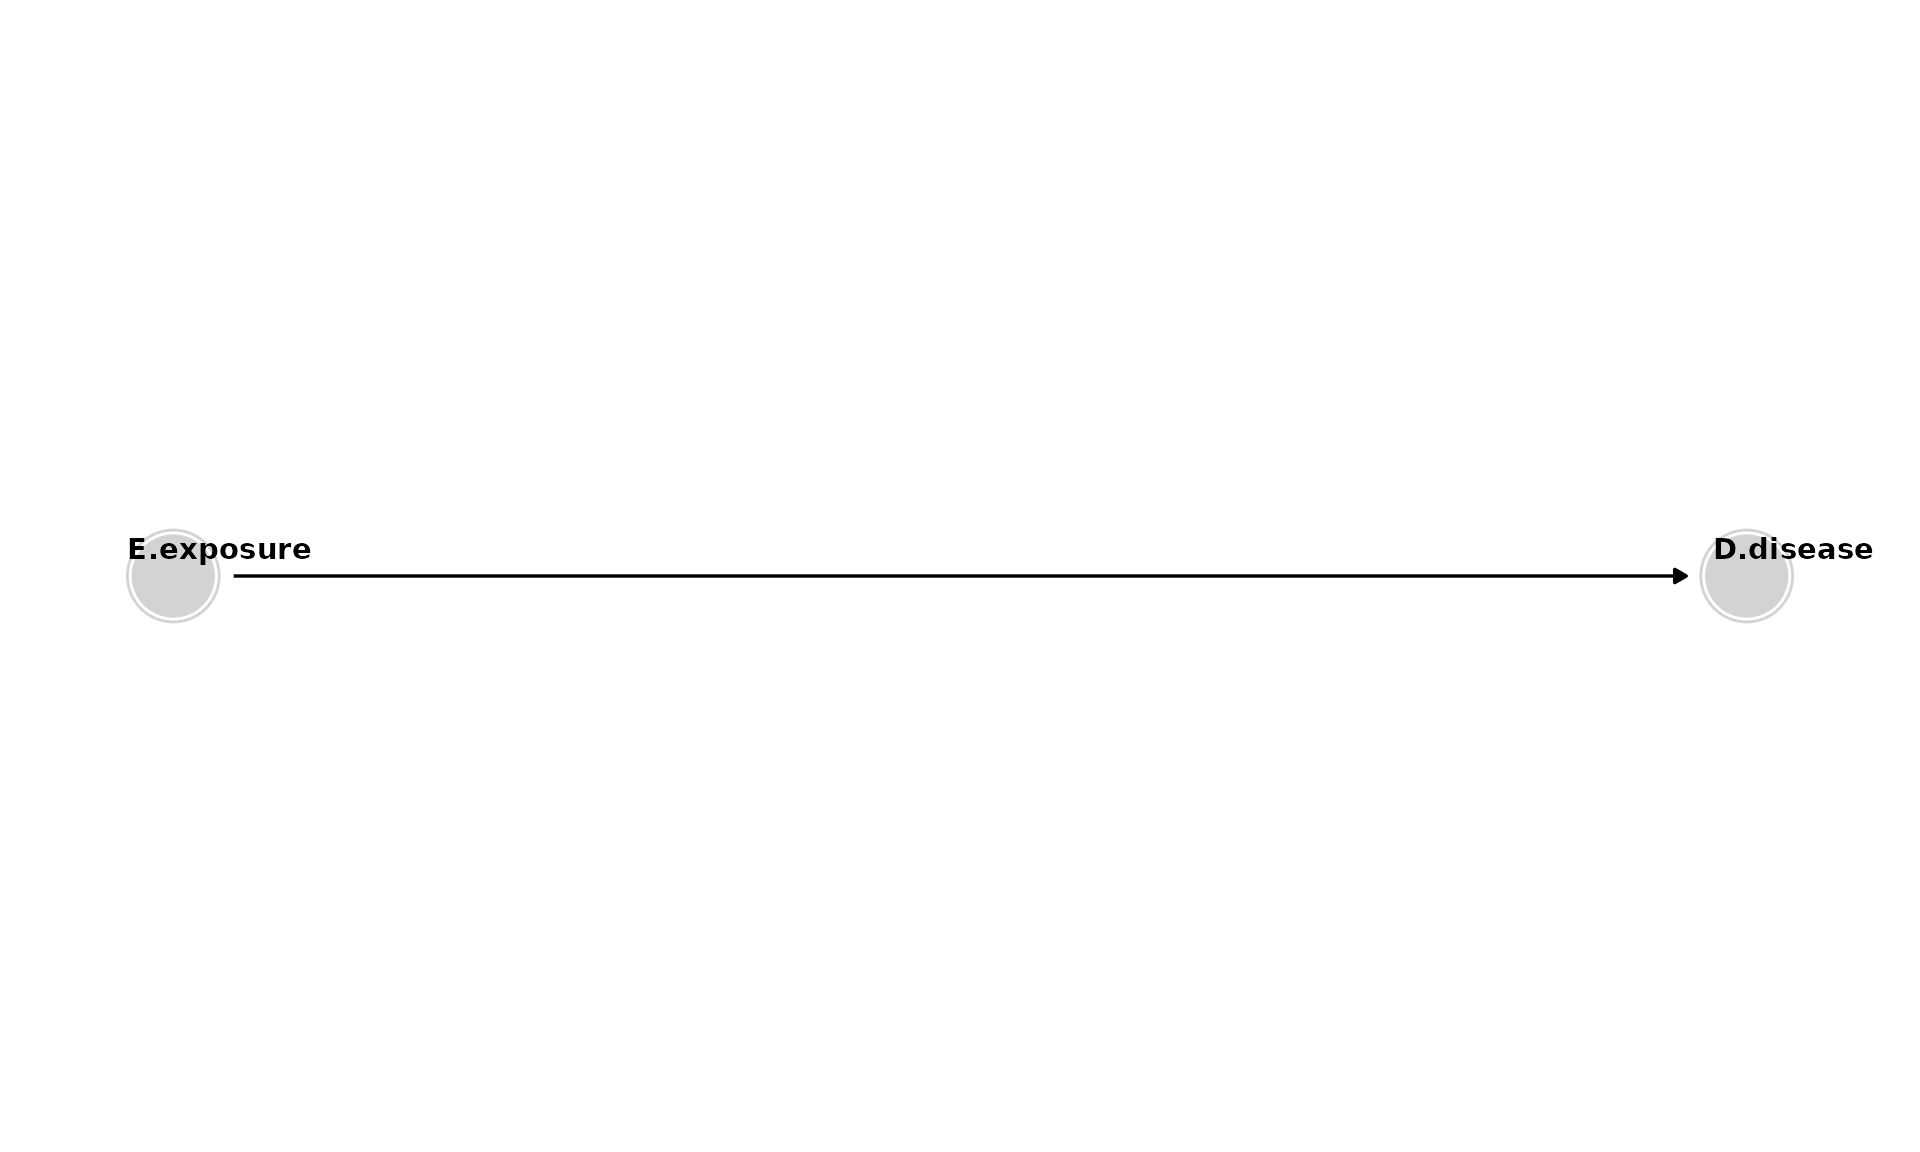
Causal Directed Acyclic Graphs
Digitale, J. C., Martin, J. N., & Glymour, M. M. (2022). Tutorial on directed acyclic graphs. Journal of clinical epidemiology, 142, 264–267. https://doi.org/10.1016/j.jclinepi.2021.08.001
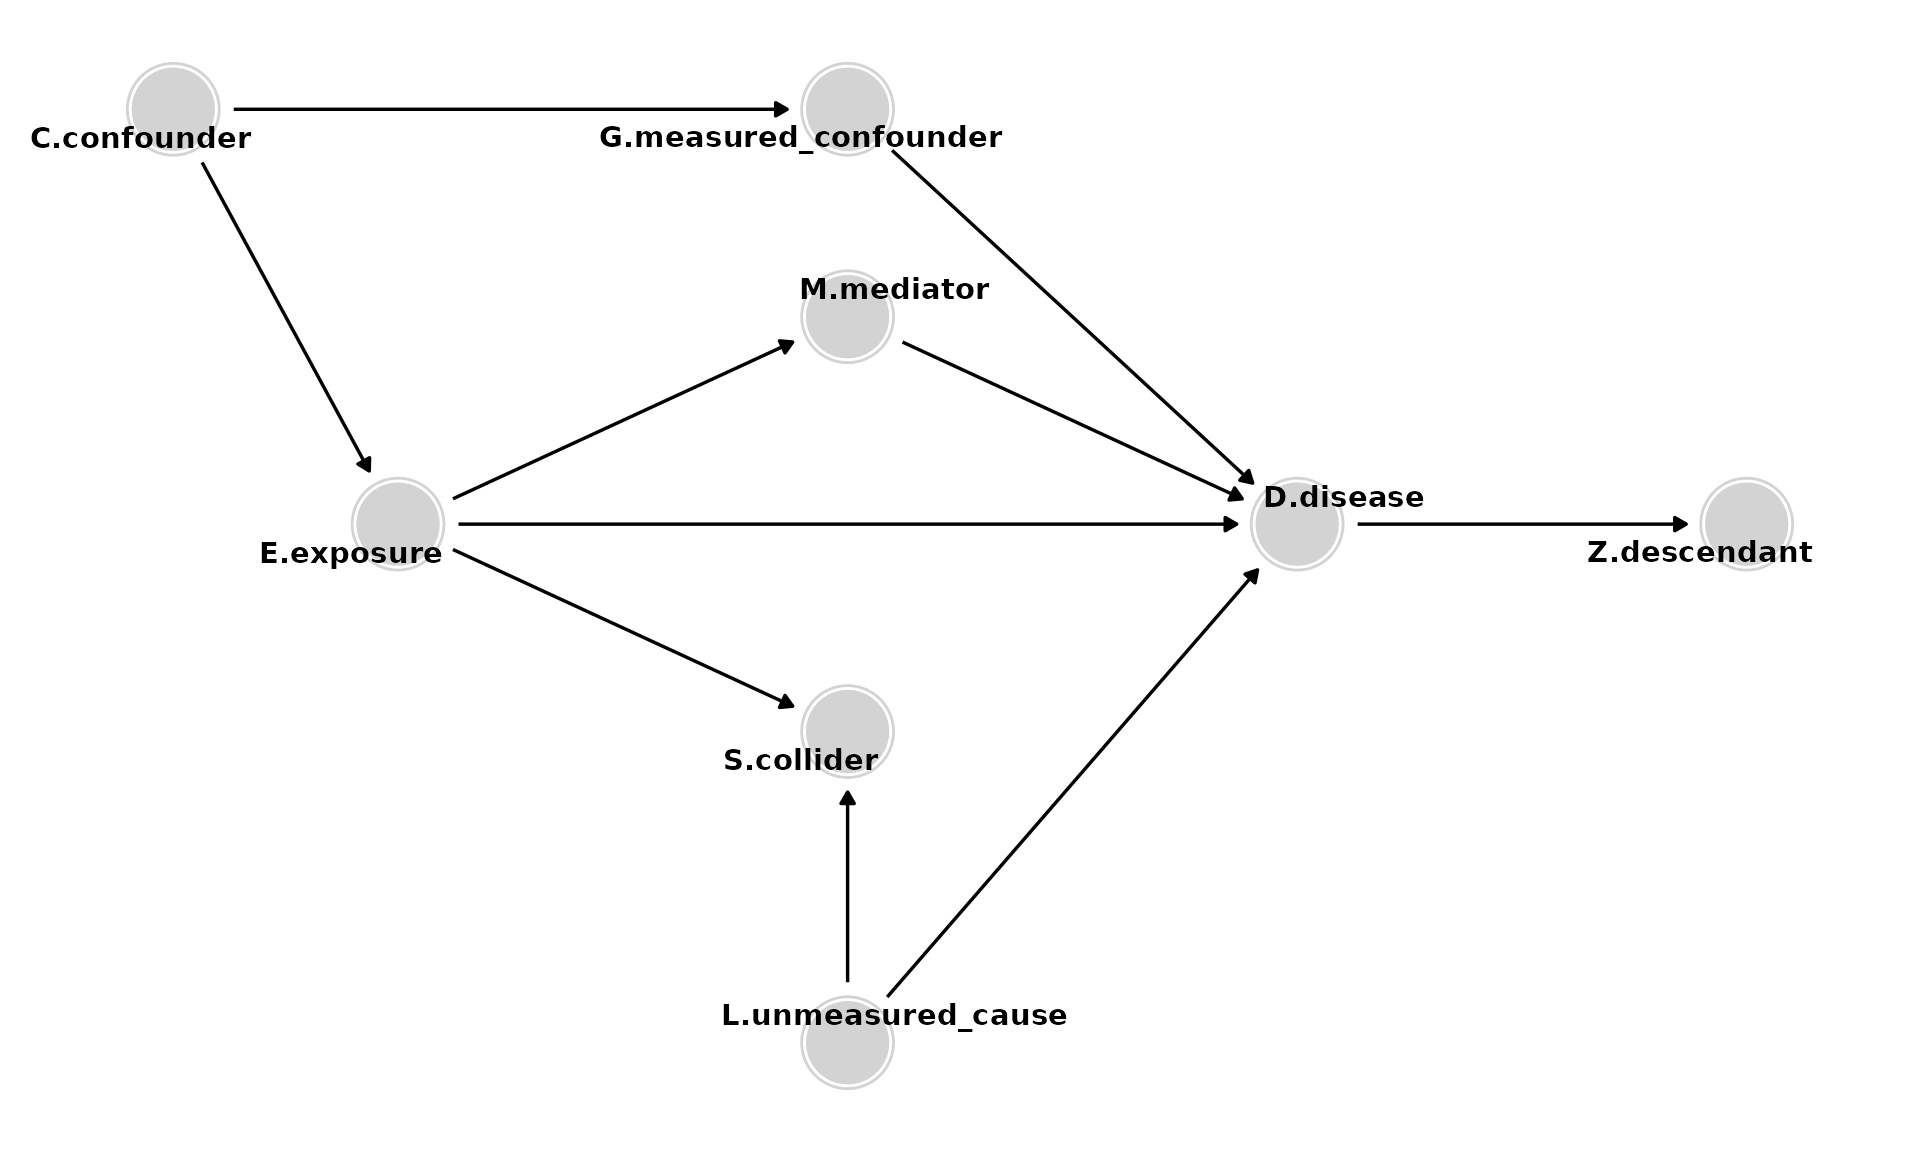
- Paths are sequences of arrows, of any direction, connecting two variables and may be causal or non-causal.
- Paths are causal if each variable causes the subsequent variable (all the arrows point in the same direction).
- Paths are non-causal if the arrows do not all point in the same direction. They contain confounders and/or colliders.
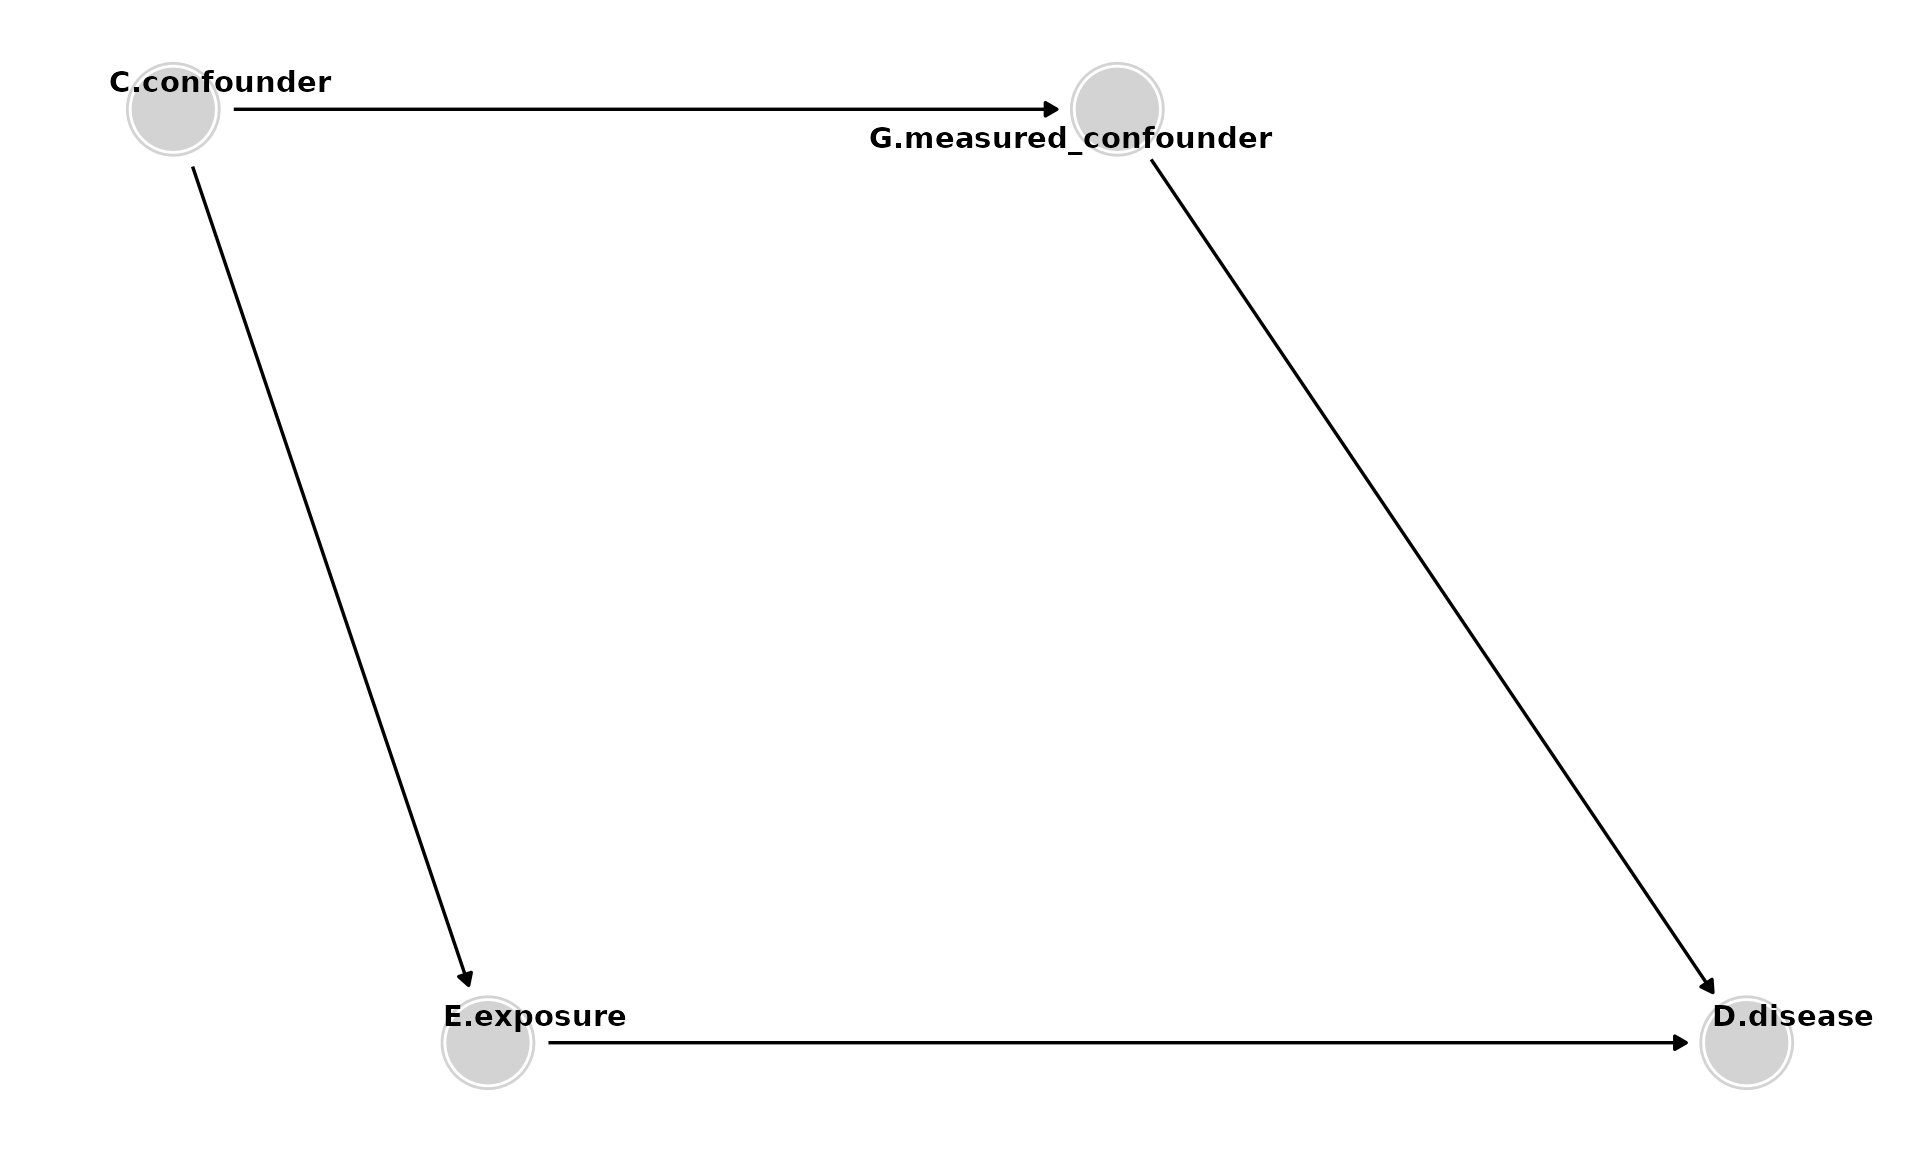
Adding Confounders
- Confounding occurs because of common (shared) causes (e.g., C) of E and D. To estimate the effect of E on D, it is necessary to control for such common causes or other variables along the non-causal path. Control for either C or G would be adequate to eliminate the confounding due to C. G may be preferable, for example, if it is easier to obtain a high-quality measurement of G.
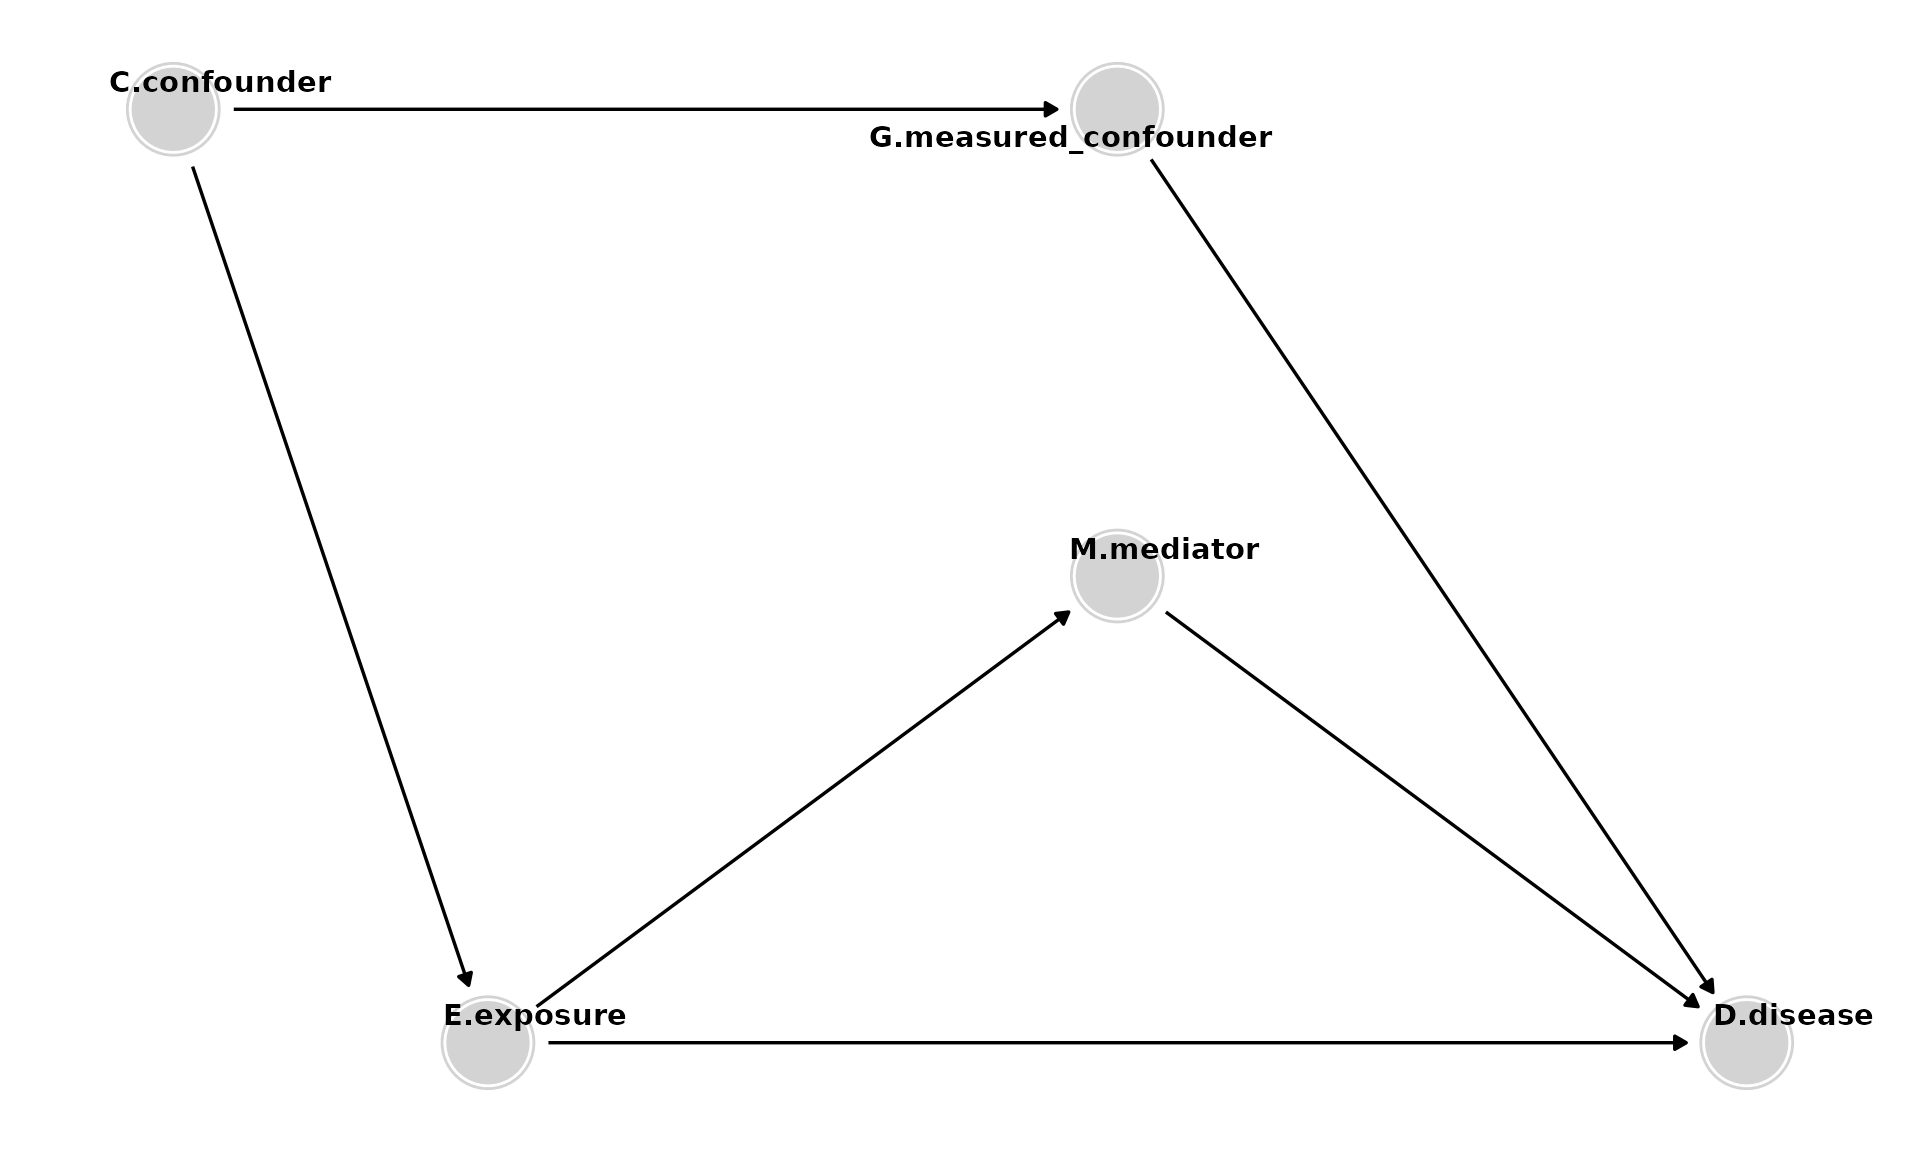
Adding Mediators
- Mediators (e.g., M) are caused by E and, in turn, cause D. They should not be controlled for to estimate the total effect of E on D. (Control for them only if you want to estimate the direct effect of E on D, excluding the mediated pathway).
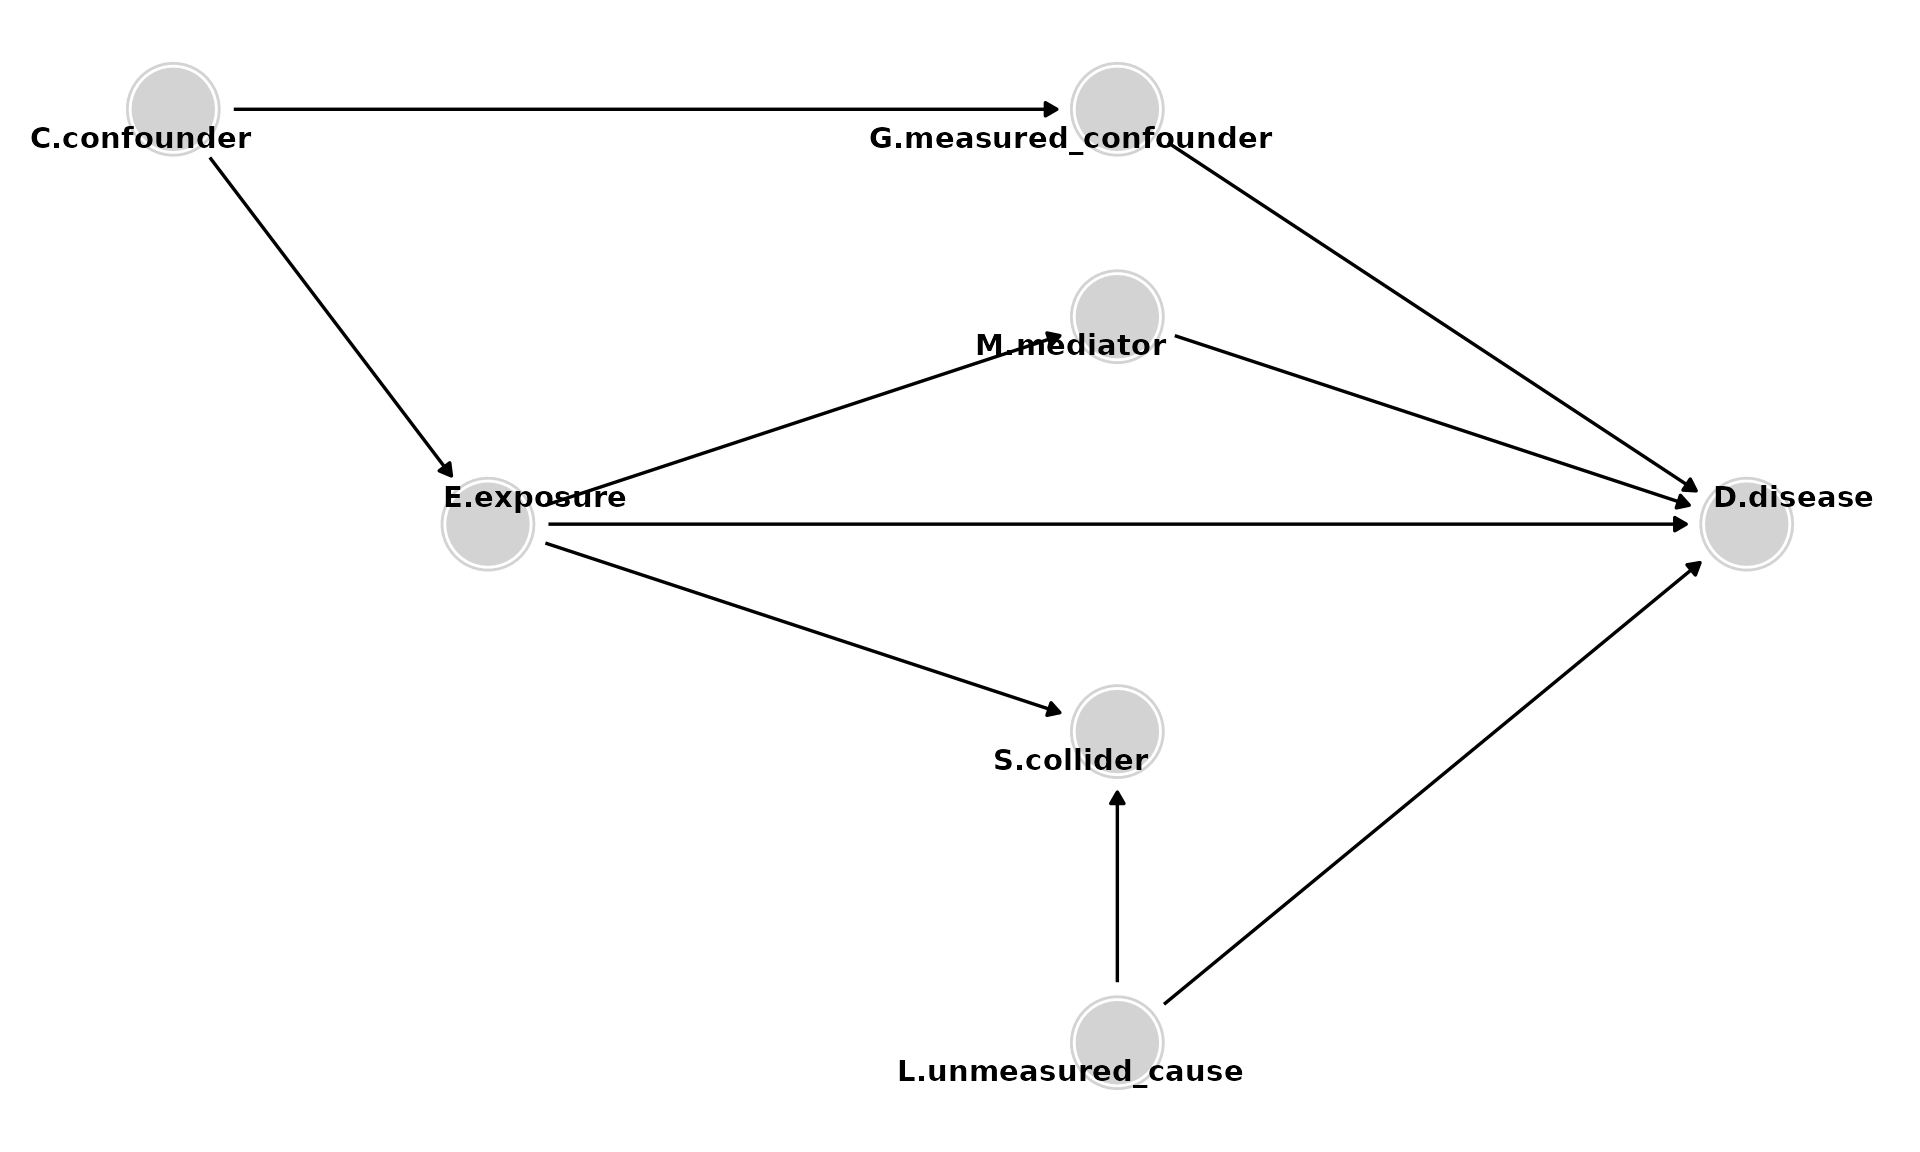
Adding Colliders
- Colliders (e.g., S) are so named because they have two arrows pointing into them. Colliders on a path block that path unless they are conditioned on (e.g., by controlling for them) or a consequence of the collider is conditioned on.
Adding Descendants
- Descendants of D (e.g., Z). Analyses should not adjust for, stratify on, or in any way condition on descendants.
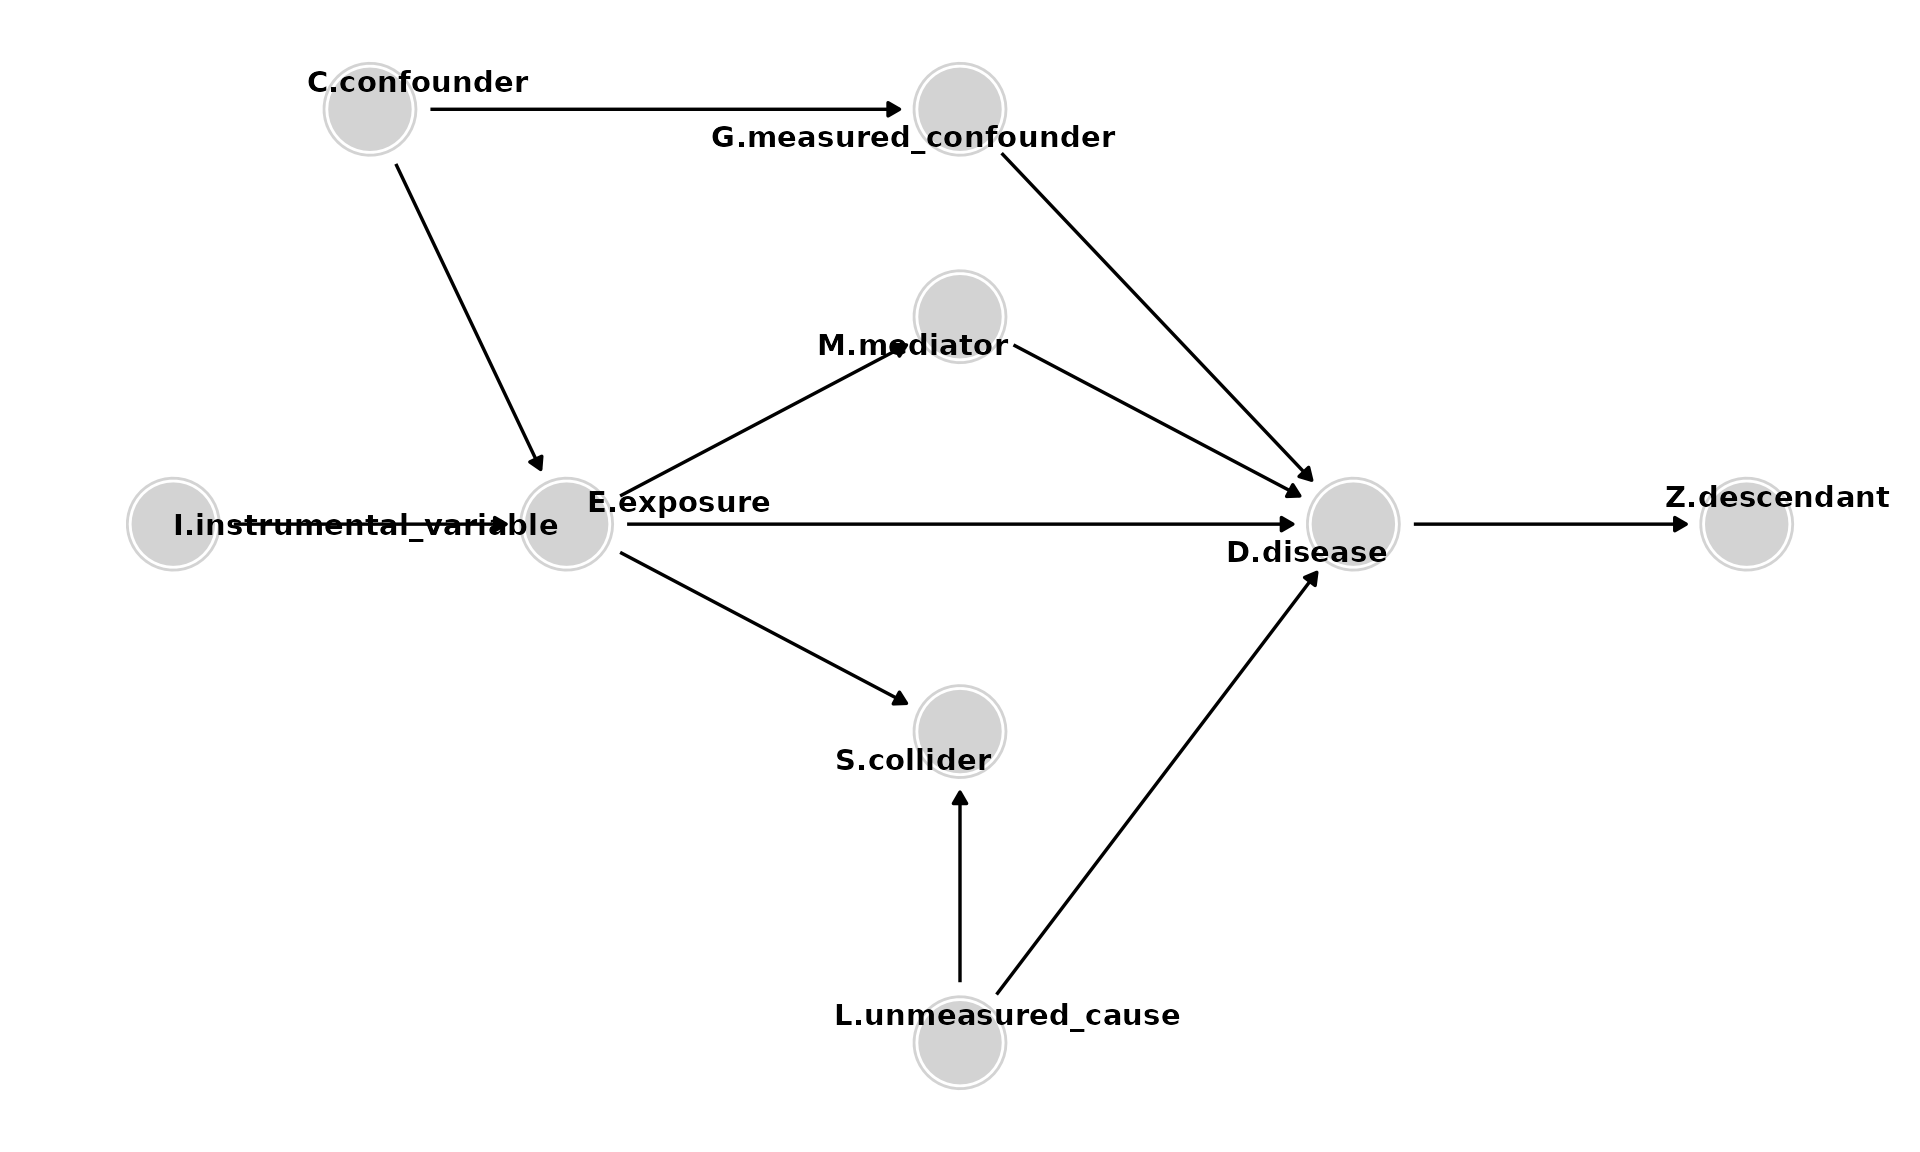
Adding Instrumental Variables
- Instrumental variables (e.g., I) are variables related to the exposure of interest that have no association with the outcome except through the exposure. Instrumental variables analysis can be used to derive effect estimates when there is intractable confounding of E and D.
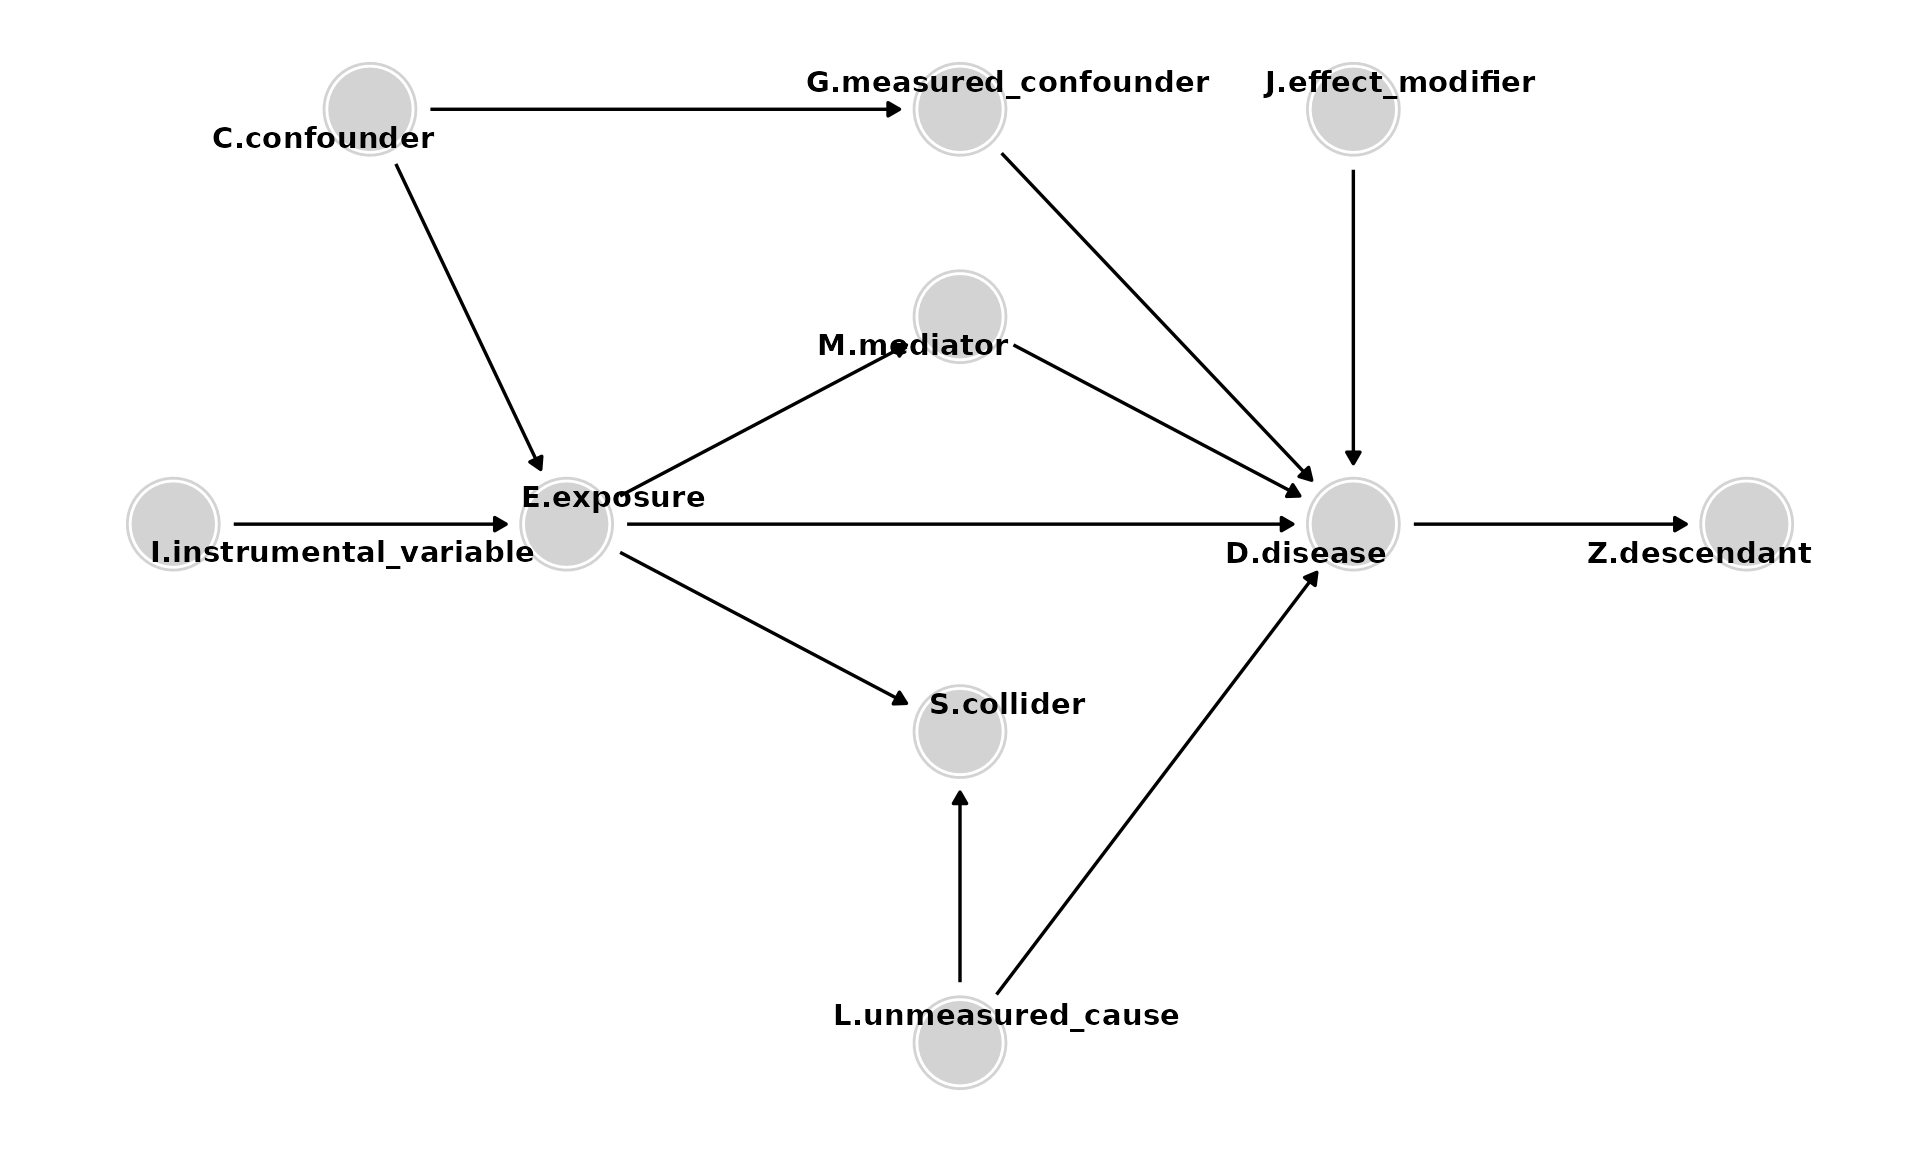
The Full DAG
- Effect modifiers (e.g., J) are variables that cause D and modify the effect of other causes of D, such as E. If E and J both cause D, then J modifies the effect of E on D on at least one effect-measure scale (additive or multiplicative).
Key Concepts
General
- Paths are sequences of arrows, of any direction, connecting two variables and may be causal or non-causal.
- Paths are causal if each variable causes the subsequent variable (all the arrows point in the same direction).
- Paths are non-causal if the arrows do not all point in the same direction. They contain confounders and/or colliders.
- Confounding occurs because of common (shared) causes (e.g., C) of E and D. To estimate the effect of E on D, it is necessary to control for such common causes or other variables along the non-causal path. Control for either C or G would be adequate to eliminate the confounding due to C. G may be preferable, for example, if it is easier to obtain a high-quality measurement of G.
- Effect modifiers (e.g., J) are variables that cause D and modify the effect of other causes of D, such as E. If E and J both cause D, then J modifies the effect of E on D on at least one effect-measure scale (additive or multiplicative).
Do NOT control for
- Mediators (e.g., M) are caused by E and, in turn, cause D. They should not be controlled for to estimate the total effect of E on D. (Control for them only if you want to estimate the direct effect of E on D, excluding the mediated pathway).
- Colliders (e.g., S) are so named because they have two arrows pointing into them. Colliders on a path block that path unless they are conditioned on (e.g., by controlling for them) or a consequence of the collider is conditioned on.
- Descendants of D (e.g., Z). Analyses should not adjust for, stratify on, or in any way condition on descendants.
- Instrumental variables (e.g., I) are variables related to the exposure of interest that have no association with the outcome except through the exposure. Instrumental variables analysis can be used to derive effect estimates when there is intractable confounding of E and D.
Exploratory data analysis
Introduction
“The greatest value of a picture is when it forces us to notice what we never expected to see.” - John W. Tukey
- Discover biases, systematic errors and unexpected variability in data.
- Graphical approach to detecting these issues. Represents a first step in data analysis and guides hypothesis testing.
- EDA helps us check the assumptions of our statistical tests.
- Opportunities for discovery are often in the outliers.
Quantile Quantile Plots
- Why use them? A primary tool for checking if our data follows a theoretical distribution.`
- Quantiles divide a distribution into equally sized bins (e.g., 100 bins for percentiles).
- We plot the quantiles from our data against the theoretical quantiles of a distribution (e.g., the normal distribution).
- If our data perfectly matches the theoretical distribution, the points will form a straight line (). Deviations from the line indicate our data does not fit that distribution.

Exploratory data analysis in high dimensions
library(GSE5859Subset)
data(GSE5859Subset) ## this loads three tables
class(geneExpression)
#> [1] "matrix" "array"
dim(geneExpression)
#> [1] 8793   24
class(sampleInfo)
#> [1] "data.frame"
dim(sampleInfo)
#> [1] 24  4
head(sampleInfo)
#>     ethnicity       date         filename group
#> 107       ASN 2005-06-23 GSM136508.CEL.gz     1
#> 122       ASN 2005-06-27 GSM136530.CEL.gz     1
#> 113       ASN 2005-06-27 GSM136517.CEL.gz     1
#> 163       ASN 2005-10-28 GSM136576.CEL.gz     1
#> 153       ASN 2005-10-07 GSM136566.CEL.gz     1
#> 161       ASN 2005-10-07 GSM136574.CEL.gz     1
Volcano plots: Setup
T-test for every row (gene) of gene expression matrix:
library(genefilter)
g <- factor(sampleInfo$group)
system.time(results <- rowttests(geneExpression, g))
#> user system elapsed
#> 0.006 0.000 0.005
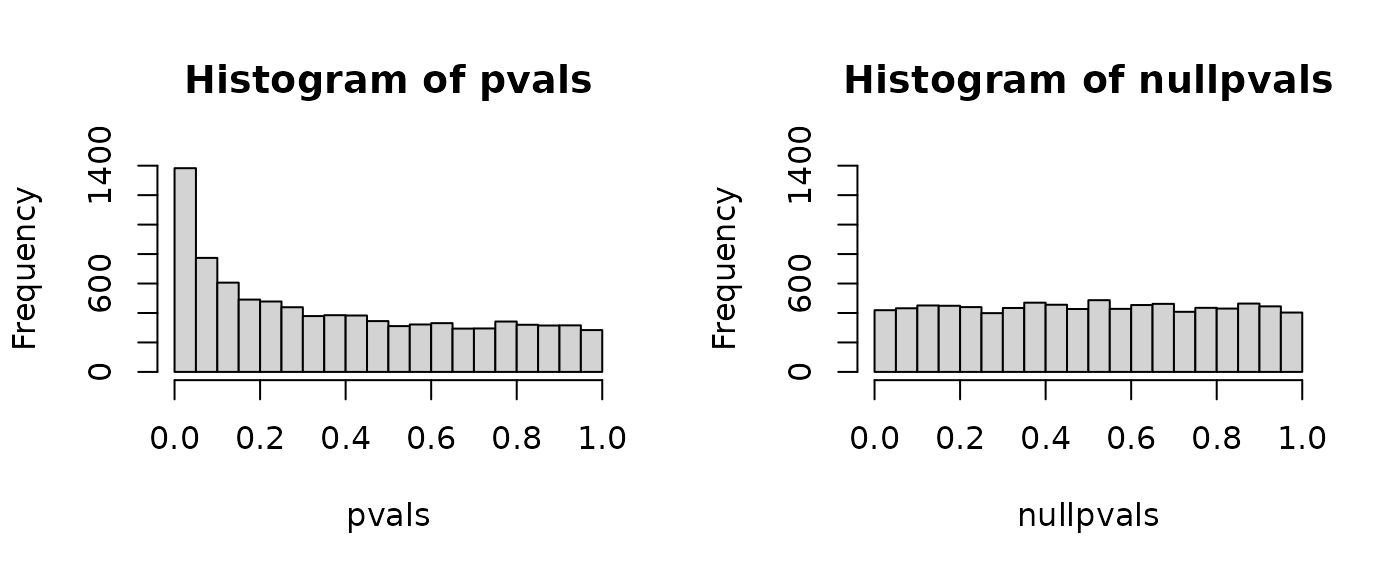
pvals <- results$p.valueNote that these 8,793 tests are done in about 0.01s
Volcano plots: Example
#>
#> Attaching package: 'dplyr'
#> The following objects are masked from 'package:Hmisc':
#>
#>     src, summarize
#> The following object is masked from 'package:MASS':
#>
#>     select
#> The following objects are masked from 'package:stats':
#>
#>     filter, lag
#> The following objects are masked from 'package:base':
#>
#>     intersect, setdiff, setequal, union
Volcano plots: Summary
- A volcano plot lets us visualize both the statistical significance (p-value) and biological significance (effect size or fold change) at the same time for thousands of genes.
- Top-right/left corners: Genes with large effect sizes and high statistical significance. These are often the most interesting candidates.
- Top-center: Genes that are statistically significant but have a small effect size.
- Bottom: Genes that are not statistically significant, regardless of their effect size.
- Can color points by significance threshold. Check for asymmetry, which might indicate biases.
P-value histograms: Setup
- If all null hypotheses are true (i.e., no genes are truly differentially expressed), we expect a flat histogram of p-values, where every p-value from 0 to 1 is equally likely.
P-value histograms: Example 2 (permutation)
Note that permuting these data doesn’t produce an ideal null p-value histogram due to batch effects:
permg <- sample(g)
permresults <- rowttests(geneExpression, permg)

ggplot(data.frame(pvalue = permresults$p.value), aes(x = pvalue)) +
  geom_histogram(breaks = seq(0, 1, 0.05), fill = "gray", color = "black") +
  labs(title = "Permuted Data p-values", x = "p-value", y = "Frequency") +
  theme_minimal()
P-value histograms: Summary
- Give a quick look at the overall results of a high-throughput experiment. A spike near zero suggests the presence of differentially expressed genes.
- A non-uniform histogram for permuted data is a red flag, suggesting non-independence between samples, often due to hidden batch effects.
MA plot
- Why use it? An MA plot is a clever transformation of a scatter plot, designed to better visualize differences between two samples (or one sample and a reference). It’s just a scatterplot rotated 45.
- The rotation helps us see systematic biases. The ‘A’ (Average) on the x-axis represents overall signal intensity, and the ‘M’ (Minus, or log-ratio) on the y-axis represents the fold change. This makes it much easier to see if the fold change is dependent on gene intensity.
library(ggplot2)
library(patchwork)
library(dplyr)

pseudo <- apply(geneExpression, 1, median)
df_ma <- data.frame(
  Sample = geneExpression[, 1],
  Pseudo = pseudo
) %>%
  mutate(
    A = (Sample + Pseudo) / 2,
    M = Sample - Pseudo
  )

p1 <- ggplot(df_ma, aes(x = Pseudo, y = Sample)) +
  geom_point(alpha = 0.3, size = 1) +
  geom_abline(slope = 1, intercept = 0, color = "red", linetype = "dashed") +
  labs(title = "Standard scatter plot", x = "Median across samples", y = "Sample 1") +
  theme_minimal()

p2 <- ggplot(df_ma, aes(x = A, y = M)) +
  geom_point(alpha = 0.3, size = 1) +
  geom_hline(yintercept = 0, color = "red", linetype = "dashed") +
  labs(title = "MA plot", x = "Average (A)", y = "Minus (M)") +
  theme_minimal()

p1 | p2
MA plot: Summary
- Useful for quality control of high-dimensional data.
- In an ideal MA plot, the cloud of points is centered on y=0 with no trend.
-
affyPLM::MAplotscreates better MA plots, adding a smoothing line to highlight departures from the horizontal.
Heatmaps
- Detailed representation of a high-dimensional dataset. The
ComplexHeatmappackage is the best as of 2025. - Important Note: Before plotting, we usually scale the data for each gene. This ensures the color pattern is driven by relative expression changes, not by a few highly expressed genes dominating the color scale.
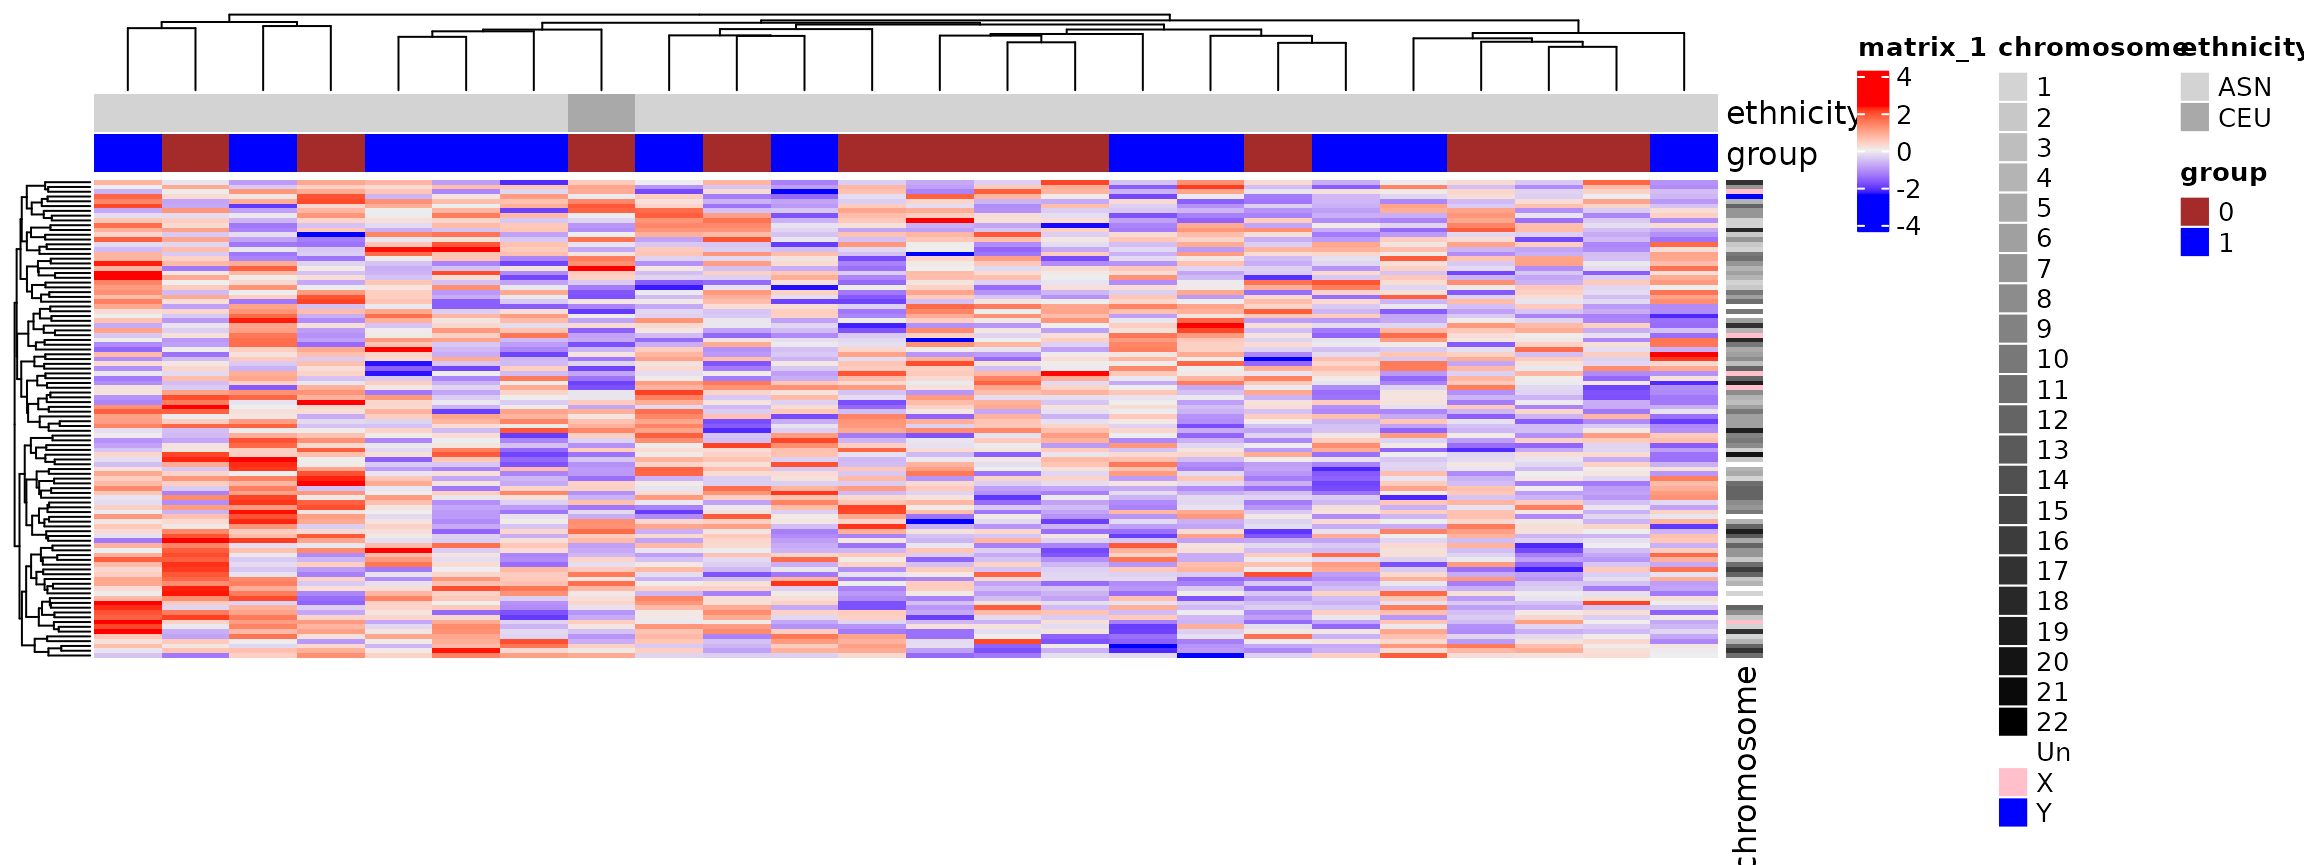
Heatmaps: Summary
- Clustering becomes slow for thousands of rows but is great for visualizing co-expressed genes and sample groups.
Colors
- Palettes: sequential (gradient), diverging (two directions from a center), qualitative (categorical).
- Keep color blindness in mind (10% of men).
RColorBrewerhas colorblind-friendly options.
Plots To Avoid
“Pie charts are a very bad way of displaying information.” - R Help
- Avoid pie charts and doughnut charts. Humans are much better at judging length and position than angles and areas. A simple bar chart is almost always a better, clearer alternative.
- Avoid pseudo 3D plots. They distort the data and make comparisons difficult.
- Use color judiciously to highlight, not to decorate.
Batch effects
Pervasiveness of batch Effects
- Pervasive in genomics and have caused high-profile retractions.
- You can’t get rid of them, but you can design your experiment to manage them.
- The Golden Rule: Make sure batch is not confounded with your variable of interest.
- Consider this nightmare scenario:
- Batch 1: All your “Control” samples, processed on Monday.
- Batch 2: All your “Treatment” samples, processed on Tuesday.
If you find a difference, is it due to the treatment or the processing day? It’s impossible to know.
Prevent such “confounding” through blocking and randomization during experimental design.
Blocking and Randomization
-
Randomization is the process of randomly assigning
participants or experimental units to different treatments or batches.
- Randomization is the only way to guarantee there can be no systematic relationship between treatment and batch, or between study subject and treatment
-
Blocking is the process of grouping similar experimental
units together to control for known sources of variability (e.g., time,
technician, reagent lot).
- For example, if you have multiple technicians, you can block by technician to ensure each treatment is applied by each technician.
- This helps reduce variability and improve the accuracy of your results.
- Only works for known sources of variability
The batch effects impact clustering
# Data from a real study where date of processing was confounded with ethnicity
library(Biobase)
#> Loading required package: BiocGenerics
#> Loading required package: generics
#>
#> Attaching package: 'generics'
#> The following object is masked from 'package:dplyr':
#>
#>     explain
#> The following objects are masked from 'package:base':
#>
#>     as.difftime, as.factor, as.ordered, intersect, is.element, setdiff,
#>     setequal, union
#>
#> Attaching package: 'BiocGenerics'
#> The following object is masked from 'package:dplyr':
#>
#>     combine
#> The following objects are masked from 'package:stats':
#>
#>     IQR, mad, sd, var, xtabs
#> The following objects are masked from 'package:base':
#>
#>     anyDuplicated, aperm, append, as.data.frame, basename, cbind,
#>     colnames, dirname, do.call, duplicated, eval, evalq, Filter, Find,
#>     get, grep, grepl, is.unsorted, lapply, Map, mapply, match, mget,
#>     order, paste, pmax, pmax.int, pmin, pmin.int, Position, rank,
#>     rbind, Reduce, rownames, sapply, saveRDS, table, tapply, unique,
#>     unsplit, which.max, which.min
#> Welcome to Bioconductor
#>
#>     Vignettes contain introductory material; view with
#>     'browseVignettes()'. To cite Bioconductor, see
#>     'citation("Biobase")', and for packages 'citation("pkgname")'.
#>
#> Attaching package: 'Biobase'
#> The following object is masked from 'package:Hmisc':
#>
#>     contents
library(genefilter)
library(GSE5859)
data(GSE5859)
geneExpression <- exprs(e)
sampleInfo <- pData(e)
year <- as.integer(format(sampleInfo$date, "%y")) - min(as.integer(format(sampleInfo$date, "%y")))
hcclass <- cutree(hclust(as.dist(1 - cor(geneExpression))), k = 5)
table(hcclass, year) # Clustering is driven by year of processing, not biology
#>        year
#> hcclass  0  1  2  3  4
#>       1  0  2  8  1  0
#>       2 25 43  0  2  0
#>       3  6  0  0  0  0
#>       4  1  7  0  0  0
#>       5  0  2  5 80 26
Approaches to correcting for batch effects
Methods can be categorized by their approach and data type:
-
Simple Rescaling (e.g.,
batchelor::rescaleBatches()):- Rescales batches to have the same mean/variance.
- Good for single-cell data because it maintains sparsity (zeros stay zeros).
-
For Known Batches (Bulk RNA-seq):
-
limma::removeBatchEffect()orsva::ComBat(): Use a linear model to regress out the effect of known batch variables (e.g., processing date, sequencing machine). Assumes cell type composition is similar across batches.
-
-
For Unknown Batches (Bulk RNA-seq):
-
sva::sva(): Identifies and creates “surrogate variables” that capture hidden sources of variation. Excellent when you don’t know the exact source of the batch effect but the p-value histogram looks problematic.
-
-
For Single-Cell Data Integration:
-
batchelor::fastMNN(): Finds Mutual Nearest Neighbors (MNNs) between batches to align them. Powerful for single-cell RNA-seq because it does not assume the same composition of cells across batches.
-