The Irritable Bowel Syndrome-associated Microbiome
Kweku Amoo
05 May, 2025
capstoneanalysis_kweku.rmdAnalysis objectives
- Import, recode, and subset data from bugsigdb.org
- Create a table of studies
- Create a clustered heatmap showing similarity of signatures from independent studies
- Calculate the frequency of appearance of each taxa in independent signatures, and identify the most frequently reported taxa
- Estimate the probability of the most frequently identified taxa occuring so frequently by chance
Packages installation
Install packages (not evaluated in vignette)
install.packages(c("devtools", "tidyverse", "kableExtra", "gt", "glue"))
devtools::install_github("waldronlab/bugSigSimple")
devtools::install_github("waldronlab/BugSigDBStats")
devtools::install_github("waldronlab/bugsigdbr")
Data import, recoding, and subset
library(bugSigSimple)
dat <- bugsigdbr::importBugSigDB(cache = FALSE)
dim(dat)
## [1] 8163 50
names(dat)## [1] "BSDB ID" "Study"
## [3] "Study design" "PMID"
## [5] "DOI" "URL"
## [7] "Authors list" "Title"
## [9] "Journal" "Year"
## [11] "Keywords" "Experiment"
## [13] "Location of subjects" "Host species"
## [15] "Body site" "UBERON ID"
## [17] "Condition" "EFO ID"
## [19] "Group 0 name" "Group 1 name"
## [21] "Group 1 definition" "Group 0 sample size"
## [23] "Group 1 sample size" "Antibiotics exclusion"
## [25] "Sequencing type" "16S variable region"
## [27] "Sequencing platform" "Statistical test"
## [29] "Significance threshold" "MHT correction"
## [31] "LDA Score above" "Matched on"
## [33] "Confounders controlled for" "Pielou"
## [35] "Shannon" "Chao1"
## [37] "Simpson" "Inverse Simpson"
## [39] "Richness" "Signature page name"
## [41] "Source" "Curated date"
## [43] "Curator" "Revision editor"
## [45] "Description" "Abundance in Group 1"
## [47] "MetaPhlAn taxon names" "NCBI Taxonomy IDs"
## [49] "State" "Reviewer"## ── Attaching core tidyverse packages ──────────────────────── tidyverse 2.0.0 ──
## ✔ dplyr 1.1.4 ✔ readr 2.1.5
## ✔ forcats 1.0.0 ✔ stringr 1.5.1
## ✔ ggplot2 3.5.2 ✔ tibble 3.2.1
## ✔ lubridate 1.9.4 ✔ tidyr 1.3.1
## ✔ purrr 1.0.4
## ── Conflicts ────────────────────────────────────────── tidyverse_conflicts() ──
## ✖ dplyr::filter() masks stats::filter()
## ✖ dplyr::lag() masks stats::lag()
## ℹ Use the conflicted package (<http://conflicted.r-lib.org/>) to force all conflicts to become errors
condition_of_interest <- c("irritable bowel syndrome")
efo <- bugsigdbr::getOntology("efo")
## Loading required namespace: ontologyIndex
## Using cached version from 2025-05-05 19:17:56
dat_condition <- bugsigdbr::subsetByOntology(dat, column = "Condition", "irritable bowel syndrome", efo) %>%
  mutate(comparison1 = paste(`Group 0 name`, `Group 1 name`, sep = " vs "))
Table of studies
bugSigSimple::createStudyTable(dat_condition)## # A tibble: 18 × 9
## `Study code` MaxCases MaxControls `Study design` Condition N_signatures PMID
## <chr> <dbl> <dbl> <chr> <chr> <int> <chr>
## 1 BarandouziZ… 80 21 cross-section… Irritabl… 2 3342…
## 2 CarrollIM_2… 16 21 case-control Irritabl… 1 2173…
## 3 CarrollIM_2… 23 23 case-control Irritabl… 3 2233…
## 4 ChassardC_2… 14 12 case-control Irritabl… 3 2231…
## 5 DubocH_2012 14 18 case-control Irritabl… 2 2235…
## 6 FourieNH_20… 11 20 case-control Irritabl… 4 2696…
## 7 JacobsJP_20… 318 177 case-control Irritabl… 2 3662…
## 8 KerckhoffsA… 41 26 case-control Irritabl… 4 1953…
## 9 MaccaferriS… 19 24 randomized co… Irritabl… 7 2271…
## 10 MeiL_2021 30 30 case-control Irritabl… 2 3366…
## 11 MertsalmiTH… 18 56 case-control Irritabl… 1 2889…
## 12 Rajilić-Sto… 62 46 case-control,… Irritabl… 8 2182…
## 13 SaulnierDM_… 28 27 case-control Irritabl… 2 2174…
## 14 ShuklaR_2015 47 30 case-control Irritabl… 11 2578…
## 15 SuQ_2023 460 460 case-control Irritabl… 12 3657…
## 16 TanaC_2010 26 26 case-control Irritabl… 2 1990…
## 17 YangL_2023 33 32 case-control Irritabl… 2 3690…
## 18 ZhuX_2021 74 20 case-control Irritabl… 8 3493…
## # ℹ 2 more variables: DOI <chr>, URL <chr>Taxon frequency tables by body site
In this table, the Binomial Test p-value corresponds to the null hypothesis
H0: the proportion of signatures in which the taxon is reported increased or decreased, relative to the total number of signatures in which it is reported, is equal to 0.5
kableExtra::kbl(bugSigSimple::createTaxonTable(gut_sigs))## Warning: Expected 7 pieces. Additional pieces discarded in 2 rows [8,
## 9].| Taxon Name | Taxonomic Level | total_signatures | increased_signatures | decreased_signatures | Binomial Test pval | kingdom | phylum | class | order | family | genus | species | n_signatures | metaphlan_name |
|---|---|---|---|---|---|---|---|---|---|---|---|---|---|---|
| Bifidobacterium | genus | 9 | 1 | 8 | 0.0390 | Bacteria | Bacillati | Actinomycetota | Actinomycetes | Bifidobacteriales | Bifidobacteriaceae | Bifidobacterium | 0 | d__Bacteria|k__Bacillati|p__Actinomycetota|c__Actinomycetes|o__Bifidobacteriales|f__Bifidobacteriaceae|g__Bifidobacterium |
| Bacteroides | genus | 8 | 3 | 5 | 0.7300 | Bacteria | Pseudomonadati | Bacteroidota | Bacteroidia | Bacteroidales | Bacteroidaceae | Bacteroides | 0 | d__Bacteria|k__Pseudomonadati|p__Bacteroidota|c__Bacteroidia|o__Bacteroidales|f__Bacteroidaceae|g__Bacteroides |
| Prevotella | genus | 8 | 0 | 8 | 0.0078 | Bacteria | Pseudomonadati | Bacteroidota | Bacteroidia | Bacteroidales | Prevotellaceae | Prevotella | 0 | d__Bacteria|k__Pseudomonadati|p__Bacteroidota|c__Bacteroidia|o__Bacteroidales|f__Prevotellaceae|g__Prevotella |
| Enterobacteriaceae | family | 8 | 7 | 1 | 0.0700 | Bacteria | Pseudomonadati | Pseudomonadota | Gammaproteobacteria | Enterobacterales | Enterobacteriaceae | NA | 0 | d__Bacteria|k__Pseudomonadati|p__Pseudomonadota|c__Gammaproteobacteria|o__Enterobacterales|f__Enterobacteriaceae |
| Dorea | genus | 7 | 5 | 2 | 0.4500 | Bacteria | Bacillati | Bacillota | Clostridia | Lachnospirales | Lachnospiraceae | Dorea | 0 | d__Bacteria|k__Bacillati|p__Bacillota|c__Clostridia|o__Lachnospirales|f__Lachnospiraceae|g__Dorea |
| Veillonella | genus | 7 | 4 | 3 | 1.0000 | Bacteria | Bacillati | Bacillota | Negativicutes | Veillonellales | Veillonellaceae | Veillonella | 0 | d__Bacteria|k__Bacillati|p__Bacillota|c__Negativicutes|o__Veillonellales|f__Veillonellaceae|g__Veillonella |
| Faecalibacterium | genus | 6 | 1 | 5 | 0.2200 | Bacteria | Bacillati | Bacillota | Clostridia | Eubacteriales | Oscillospiraceae | Faecalibacterium | 0 | d__Bacteria|k__Bacillati|p__Bacillota|c__Clostridia|o__Eubacteriales|f__Oscillospiraceae|g__Faecalibacterium |
| Clostridioides difficile | species | 6 | 6 | 0 | 0.0310 | Bacteria | Bacillati | Bacillota | Clostridia | Peptostreptococcales | Peptostreptococcaceae | Clostridioides | 0 | d__Bacteria|k__Bacillati|p__Bacillota|c__Clostridia|o__Peptostreptococcales|f__Peptostreptococcaceae|g__Clostridioides|s__Clostridioides difficile |
| Phocaeicola plebeius | species | 6 | 1 | 5 | 0.2200 | Bacteria | Pseudomonadati | Bacteroidota | Bacteroidia | Bacteroidales | Bacteroidaceae | Phocaeicola | 0 | d__Bacteria|k__Pseudomonadati|p__Bacteroidota|c__Bacteroidia|o__Bacteroidales|f__Bacteroidaceae|g__Phocaeicola|s__Phocaeicola plebeius |
| Odoribacter | genus | 6 | 1 | 5 | 0.2200 | Bacteria | Pseudomonadati | Bacteroidota | Bacteroidia | Bacteroidales | Odoribacteraceae | Odoribacter | 0 | d__Bacteria|k__Pseudomonadati|p__Bacteroidota|c__Bacteroidia|o__Bacteroidales|f__Odoribacteraceae|g__Odoribacter |
Cluster analysis
Note, this EDA should really be done before hypothesis testing.
First calculate pairwise overlaps for all signatures of length > 1:
allsigs <- bugsigdbr::getSignatures(dat_condition, tax.id.type = "taxname")
allsigs <- allsigs[sapply(allsigs, length) > 1] #require length > 1
length(allsigs)
## [1] 59
mydists <- BugSigDBStats::calcPairwiseOverlaps(allsigs)
dim(mydists)
## [1] 334 8What is the distribution of signature lengths?
library(ggplot2)
siglengths <- sapply(allsigs, length)
siglengths.df <- data.frame(siglengths = siglengths)
ggplot(siglengths.df, aes(x=siglengths)) +
  geom_bar()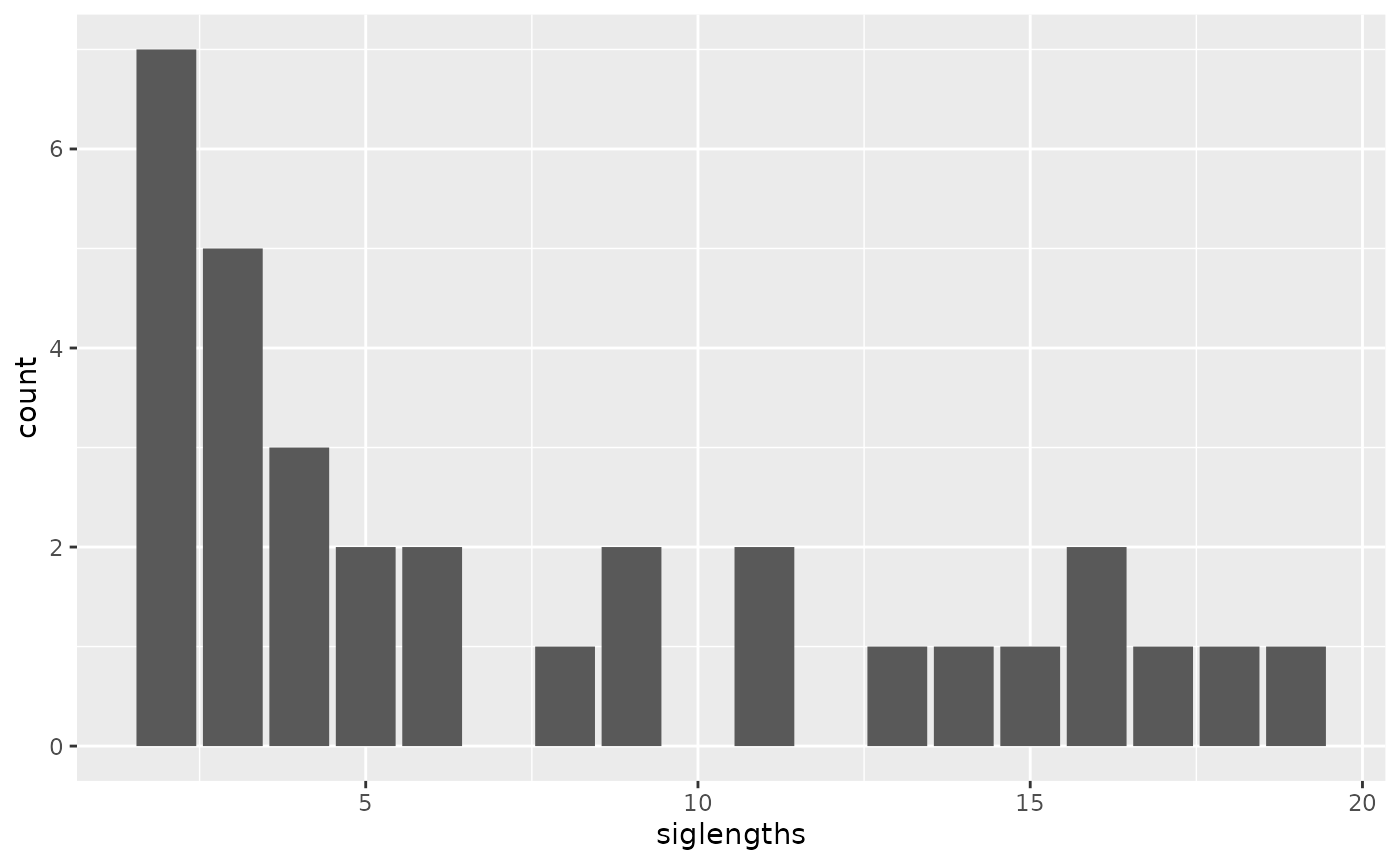
table(siglengths)## siglengths
## 2 3 4 5 6 7 8 9 10 11 12 13 14 15 16 17 18 19 20 23 26 27 36 40
## 14 8 5 5 2 1 2 1 3 2 1 2 1 1 1 1 1 1 2 1 1 1 1 1Create a matrix of Jaccard similarities (0 for no overlap, 1 for 100% overlap)
jmat <- BugSigDBStats::calcJaccardSimilarity(allsigs)## Loading required package: grid## ========================================
## ComplexHeatmap version 2.24.0
## Bioconductor page: http://bioconductor.org/packages/ComplexHeatmap/
## Github page: https://github.com/jokergoo/ComplexHeatmap
## Documentation: http://jokergoo.github.io/ComplexHeatmap-reference
##
## If you use it in published research, please cite either one:
## - Gu, Z. Complex Heatmap Visualization. iMeta 2022.
## - Gu, Z. Complex heatmaps reveal patterns and correlations in multidimensional
## genomic data. Bioinformatics 2016.
##
##
## The new InteractiveComplexHeatmap package can directly export static
## complex heatmaps into an interactive Shiny app with zero effort. Have a try!
##
## This message can be suppressed by:
## suppressPackageStartupMessages(library(ComplexHeatmap))
## ========================================
ha <- HeatmapAnnotation(`Signature Length` = anno_barplot(siglengths))
hr <- rowAnnotation(`Signature Length` = anno_barplot(siglengths))
hm <- Heatmap(
  jmat,
  top_annotation = ha, left_annotation = hr,
  row_names_max_width = unit(20, "cm"),
  column_names_max_height = unit(20, "cm"),
#  row_labels = sub(".+:", "", rownames(jmat)),  #get rid of study labels
  column_labels = sub(".+:", "", colnames(jmat))
)
hm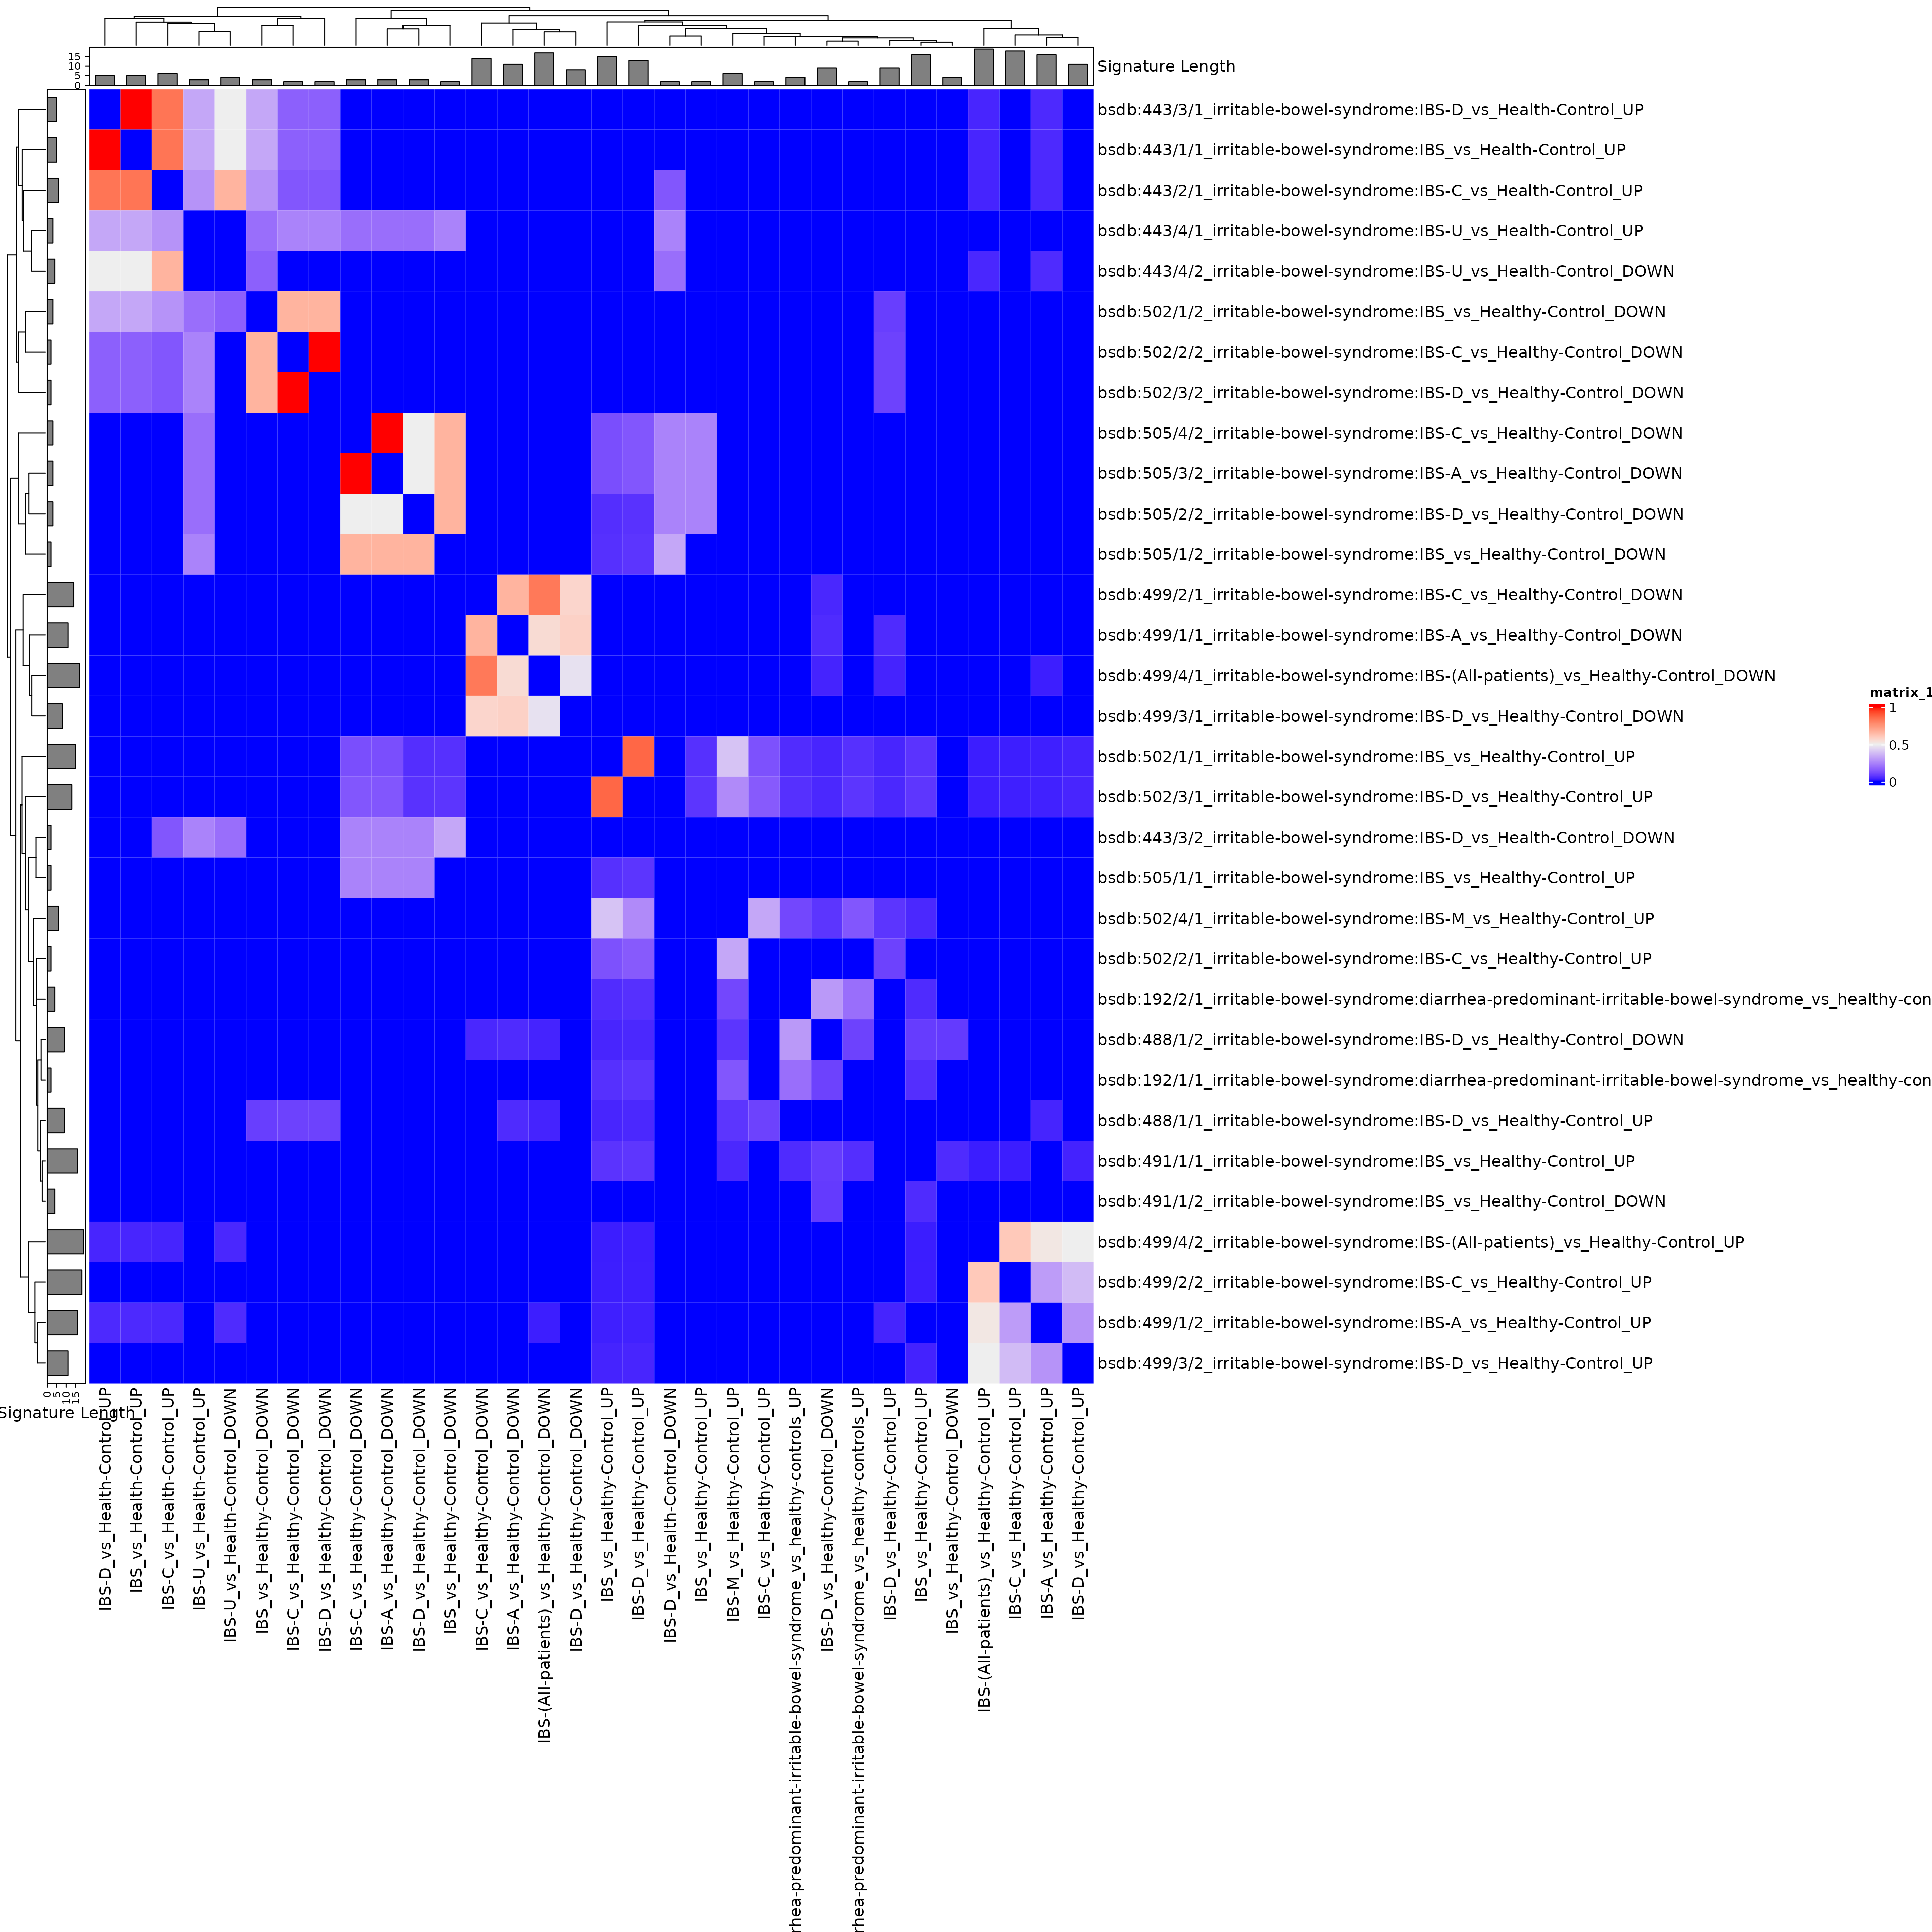
Use this interactively to make an interactive heatmap. Some expanding of the default size is required to see anything. Creating a sub-heatmap, then exporting it as a table, allows in-depth identification of the subgroups.
library(InteractiveComplexHeatmap)
hm <- draw(hm)
htShiny(hm)
This tree can be cut to show the clusters, for example. The clusters of more than 1 signature but less than ~10 signatures are most likely to be something interesting.
clusts <- sort(cutree(hc, k = 8))  #set the number of clusters here with k
lapply(unique(clusts), function(i) names(clusts)[clusts == i])
## [[1]]
## [1] "bsdb:19533811/1/2_Irritable-bowel-syndrome:IBS_vs_Healthy-Control_DOWN"
## [2] "bsdb:19903265/1/1_Irritable-bowel-syndrome:IBS_vs_Healthy-Control_UP"
## [3] "bsdb:21737778/1/1_Irritable-bowel-syndrome:IBS-D_vs_Healthy-Control_DOWN"
## [4] "bsdb:21741921/1/1_Irritable-bowel-syndrome:IBS_vs_Healthy-Control_UP"
## [5] "bsdb:21741921/1/2_Irritable-bowel-syndrome:IBS_vs_Healthy-Control_DOWN"
## [6] "bsdb:22315951/1/1_Irritable-bowel-syndrome:constipated-IBS_vs_Healthy-Control_DOWN"
## [7] "bsdb:22315951/1/3_Irritable-bowel-syndrome:constipated-IBS_vs_Healthy-Control_DOWN"
## [8] "bsdb:22339879/1/1_Irritable-bowel-syndrome:diarrhea-predominant-irritable-bowel-syndrome_vs_healthy-controls_UP"
## [9] "bsdb:22339879/2/1_Irritable-bowel-syndrome:diarrhea-predominant-irritable-bowel-syndrome_vs_healthy-controls_UP"
## [10] "bsdb:22713265/2/1_Irritable-bowel-syndrome:IBS-C_vs_Healthy-Control_UP"
## [11] "bsdb:25784074/1/1_Irritable-bowel-syndrome:IBS_vs_Healthy-Control_UP"
## [12] "bsdb:25784074/2/1_Irritable-bowel-syndrome:IBS-C_vs_Health-Control_UP"
## [13] "bsdb:25784074/3/1_Irritable-bowel-syndrome:IBS-D_vs_Health-Control_UP"
## [14] "bsdb:25784074/3/2_Irritable-bowel-syndrome:IBS-D_vs_Health-Control_DOWN"
## [15] "bsdb:25784074/5/2_Irritable-bowel-syndrome:Irritable-Bowel-Syndrome,-constipation-predominant-(IBS-C)_vs_Irritable-Bowel-Syndrome,-diarrhea-predominant-(IBS-D)_DOWN"
## [16] "bsdb:25784074/6/1_Irritable-bowel-syndrome:Visible-abdominal-distension_vs_No-Visible-abdominal-distension_UP"
## [17] "bsdb:26963804/1/1_Irritable-bowel-syndrome:irritable-bowel-syndrome_vs_control_UP"
## [18] "bsdb:26963804/1/2_Irritable-bowel-syndrome:irritable-bowel-syndrome_vs_control_DOWN"
## [19] "bsdb:26963804/2/1_Irritable-bowel-syndrome:overweight-irritable-bowel-syndrome_vs_control_UP"
## [20] "bsdb:26963804/2/2_Irritable-bowel-syndrome:overweight-irritable-bowel-syndrome_vs_control_DOWN"
## [21] "bsdb:33429936/1/1_Irritable-bowel-syndrome:IBS_vs_Healthy-control_UP"
## [22] "bsdb:33429936/1/2_Irritable-bowel-syndrome:IBS_vs_Healthy-control_DOWN"
## [23] "bsdb:33663411/1/1_Irritable-bowel-syndrome:IBS-D_vs_Healthy-Control_UP"
## [24] "bsdb:33663411/1/2_Irritable-bowel-syndrome:IBS-D_vs_Healthy-Control_DOWN"
## [25] "bsdb:34937163/1/1_Irritable-bowel-syndrome:IBS-D-patients-(Duodenal-mucosa-samples)_vs_Healthy-controls-(Duodenal-mucosa-samples)_UP"
## [26] "bsdb:34937163/1/2_Irritable-bowel-syndrome:IBS-D-patients-(Duodenal-mucosa-samples)_vs_Healthy-controls-(Duodenal-mucosa-samples)_DOWN"
## [27] "bsdb:34937163/2/1_Irritable-bowel-syndrome:IBS-D-patients-(Duodenal-lumen-samples)_vs_Healthy-controls-(Duodenal-lumen-samples)_UP"
## [28] "bsdb:34937163/2/2_Irritable-bowel-syndrome:IBS-D-patients-(Duodenal-lumen-samples)_vs_Healthy-controls-(Duodenal-lumen-samples)_DOWN"
## [29] "bsdb:34937163/3/1_Irritable-bowel-syndrome:IBS-D-patients-(Rectal-mucosa-samples)_vs_Healthy-controls-(Rectal-mucosa-samples)_UP"
## [30] "bsdb:34937163/3/2_Irritable-bowel-syndrome:IBS-D-patients-(Rectal-mucosa-samples)_vs_Healthy-controls-(Rectal-mucosa-samples)_DOWN"
## [31] "bsdb:34937163/4/2_Irritable-bowel-syndrome:IBS-D-patients-(Rectal-lumen-samples)_vs_Healthy-controls-(Rectal-lumen-samples)_DOWN"
## [32] "bsdb:36573834/1/1_Irritable-bowel-syndrome:IBS-C-(IBS-Constipation)_vs_Non-IBS1-(Non-irritable-bowel-syndrome-1)_DOWN"
## [33] "bsdb:36573834/1/2_Irritable-bowel-syndrome:IBS-C-(IBS-Constipation)_vs_Non-IBS1-(Non-irritable-bowel-syndrome-1)_UP"
## [34] "bsdb:36573834/2/1_Irritable-bowel-syndrome:IBS-D-(IBS-Diarrhea)_vs_Non-IBS2-(Non-irritable-bowel-syndrome-2)_DOWN"
## [35] "bsdb:36573834/2/2_Irritable-bowel-syndrome:IBS-D-(IBS-Diarrhea)_vs_Non-IBS2-(Non-irritable-bowel-syndrome-2)_UP"
## [36] "bsdb:36573834/3/1_Irritable-bowel-syndrome:IBS-U-(IBS-Unclassified)_vs_Non-IBS3-(Non-irritable-bowel-syndrome-3)_DOWN"
## [37] "bsdb:36573834/3/2_Irritable-bowel-syndrome:IBS-U-(IBS-Unclassified)_vs_Non-IBS3-(Non-irritable-bowel-syndrome-3)_UP"
## [38] "bsdb:36624530/1/1_Irritable-bowel-syndrome:Irritable-Bowel-Syndrome_vs_Healthy-controls_UP"
## [39] "bsdb:36624530/1/2_Irritable-bowel-syndrome:Irritable-Bowel-Syndrome_vs_Healthy-controls_DOWN"
## [40] "bsdb:36905309/1/1_Irritable-bowel-syndrome:IBS-patients-(Irritable-Bowel-Syndrome)_vs_Healthy-Controls-(HC)_UP"
## [41] "bsdb:36905309/1/2_Irritable-bowel-syndrome:IBS-patients-(Irritable-Bowel-Syndrome)_vs_Healthy-Controls-(HC)_DOWN"
##
## [[2]]
## [1] "bsdb:21820992/1/1_Irritable-bowel-syndrome:IBS-A_vs_Healthy-Control_DOWN"
## [2] "bsdb:21820992/2/1_Irritable-bowel-syndrome:IBS-C_vs_Healthy-Control_DOWN"
## [3] "bsdb:21820992/3/1_Irritable-bowel-syndrome:IBS-D_vs_Healthy-Control_DOWN"
## [4] "bsdb:21820992/4/1_Irritable-bowel-syndrome:IBS-(All-patients)_vs_Healthy-Control_DOWN"
##
## [[3]]
## [1] "bsdb:21820992/1/2_Irritable-bowel-syndrome:IBS-A_vs_Healthy-Control_UP"
## [2] "bsdb:21820992/2/2_Irritable-bowel-syndrome:IBS-C_vs_Healthy-Control_UP"
## [3] "bsdb:21820992/3/2_Irritable-bowel-syndrome:IBS-D_vs_Healthy-Control_UP"
## [4] "bsdb:21820992/4/2_Irritable-bowel-syndrome:IBS-(All-patients)_vs_Healthy-Control_UP"
##
## [[4]]
## [1] "bsdb:22713265/1/1_Irritable-bowel-syndrome:IBS_vs_Healthy-Control_UP"
## [2] "bsdb:22713265/3/1_Irritable-bowel-syndrome:IBS-D_vs_Healthy-Control_UP"
## [3] "bsdb:22713265/4/1_Irritable-bowel-syndrome:IBS-M_vs_Healthy-Control_UP"
##
## [[5]]
## [1] "bsdb:22713265/1/2_Irritable-bowel-syndrome:IBS_vs_Healthy-Control_DOWN"
## [2] "bsdb:22713265/2/2_Irritable-bowel-syndrome:IBS-C_vs_Healthy-Control_DOWN"
## [3] "bsdb:28891262/1/1_Irritable-bowel-syndrome:Irritable-Bowel-Syndrome-positive-(IBS+)_vs_Irritable-Bowel-Syndrome-negative-(IBS-)_DOWN"
##
## [[6]]
## [1] "bsdb:22713265/3/2_Irritable-bowel-syndrome:IBS-D_vs_Healthy-Control_DOWN"
##
## [[7]]
## [1] "bsdb:36573834/5/1_Irritable-bowel-syndrome:IBS-C-(IBS-Constipation)-Validation-Cohort_vs_Non-IBS-(Non-irritable-bowel-syndrome)_DOWN"
## [2] "bsdb:36573834/6/1_Irritable-bowel-syndrome:IBS-D-(IBS-Diarrhea)-Validation-Cohort_vs_Non-IBS-(Non-irritable-bowel-syndrome)_DOWN"
##
## [[8]]
## [1] "bsdb:36573834/7/1_Irritable-bowel-syndrome:IBS-U-(IBS-Unclassified)-Validation-Cohort_vs_Non-IBS-(Non-irritable-bowel-syndrome)_DOWN"Create a wide-format dataframe
This would be suitable for regression analysis.
dat_withsigs <- filter(dat_condition, !is.na(dat_condition$`NCBI Taxonomy IDs`))
sigs <- bugsigdbr::getSignatures(dat_withsigs, tax.id.type = "taxname")
cmat <- t(safe::getCmatrix(sigs, as.matrix = TRUE, min.size = 0, prune = FALSE))
## WARNING: rows are sorted elements of keyword.list
## 72 categories formed
cdf <- data.frame(cmat, stringsAsFactors = FALSE, check.names = FALSE)
cdf <- cbind(dat_withsigs, cdf)
colnames(cdf)[1:54]
## [1] "BSDB ID" "Study"
## [3] "Study design" "PMID"
## [5] "DOI" "URL"
## [7] "Authors list" "Title"
## [9] "Journal" "Year"
## [11] "Keywords" "Experiment"
## [13] "Location of subjects" "Host species"
## [15] "Body site" "UBERON ID"
## [17] "Condition" "EFO ID"
## [19] "Group 0 name" "Group 1 name"
## [21] "Group 1 definition" "Group 0 sample size"
## [23] "Group 1 sample size" "Antibiotics exclusion"
## [25] "Sequencing type" "16S variable region"
## [27] "Sequencing platform" "Statistical test"
## [29] "Significance threshold" "MHT correction"
## [31] "LDA Score above" "Matched on"
## [33] "Confounders controlled for" "Pielou"
## [35] "Shannon" "Chao1"
## [37] "Simpson" "Inverse Simpson"
## [39] "Richness" "Signature page name"
## [41] "Source" "Curated date"
## [43] "Curator" "Revision editor"
## [45] "Description" "Abundance in Group 1"
## [47] "MetaPhlAn taxon names" "NCBI Taxonomy IDs"
## [49] "State" "Reviewer"
## [51] "comparison1" "[Clostridium] cellulosi"
## [53] "[Clostridium] hylemonae" "[Clostridium] innocuum"Note this has a number of columns that are mostly zeros, it could be filtered significantly for any regression or machine learning analysis:
table(cdf[["Bifidobacterium catenulatum"]])##
## 0 1
## 69 3Create another heatmap on correlations of presence/absence of taxa. This is not necessary because the previous Jaccard Index heatmap is probably better, it is just a demonstration of doing something with the taxa presence/absence directly.
sigcors <- cor(t(cmat))
siglengths <- sapply(sigs, length)
ha <- HeatmapAnnotation(`Signature Length` = anno_barplot(siglengths))
hr <- rowAnnotation(`Signature Length` = anno_barplot(siglengths))
hm <- Heatmap(
  sigcors,
  top_annotation = ha, left_annotation = hr,
  row_names_max_width = unit(20, "cm"),
  column_names_max_height = unit(20, "cm"),
 # row_labels = sub(".+:", "", rownames(sigcors)), ##removing study just to make signature names legible
  column_labels = sub(".+:", "", colnames(sigcors))
)
hm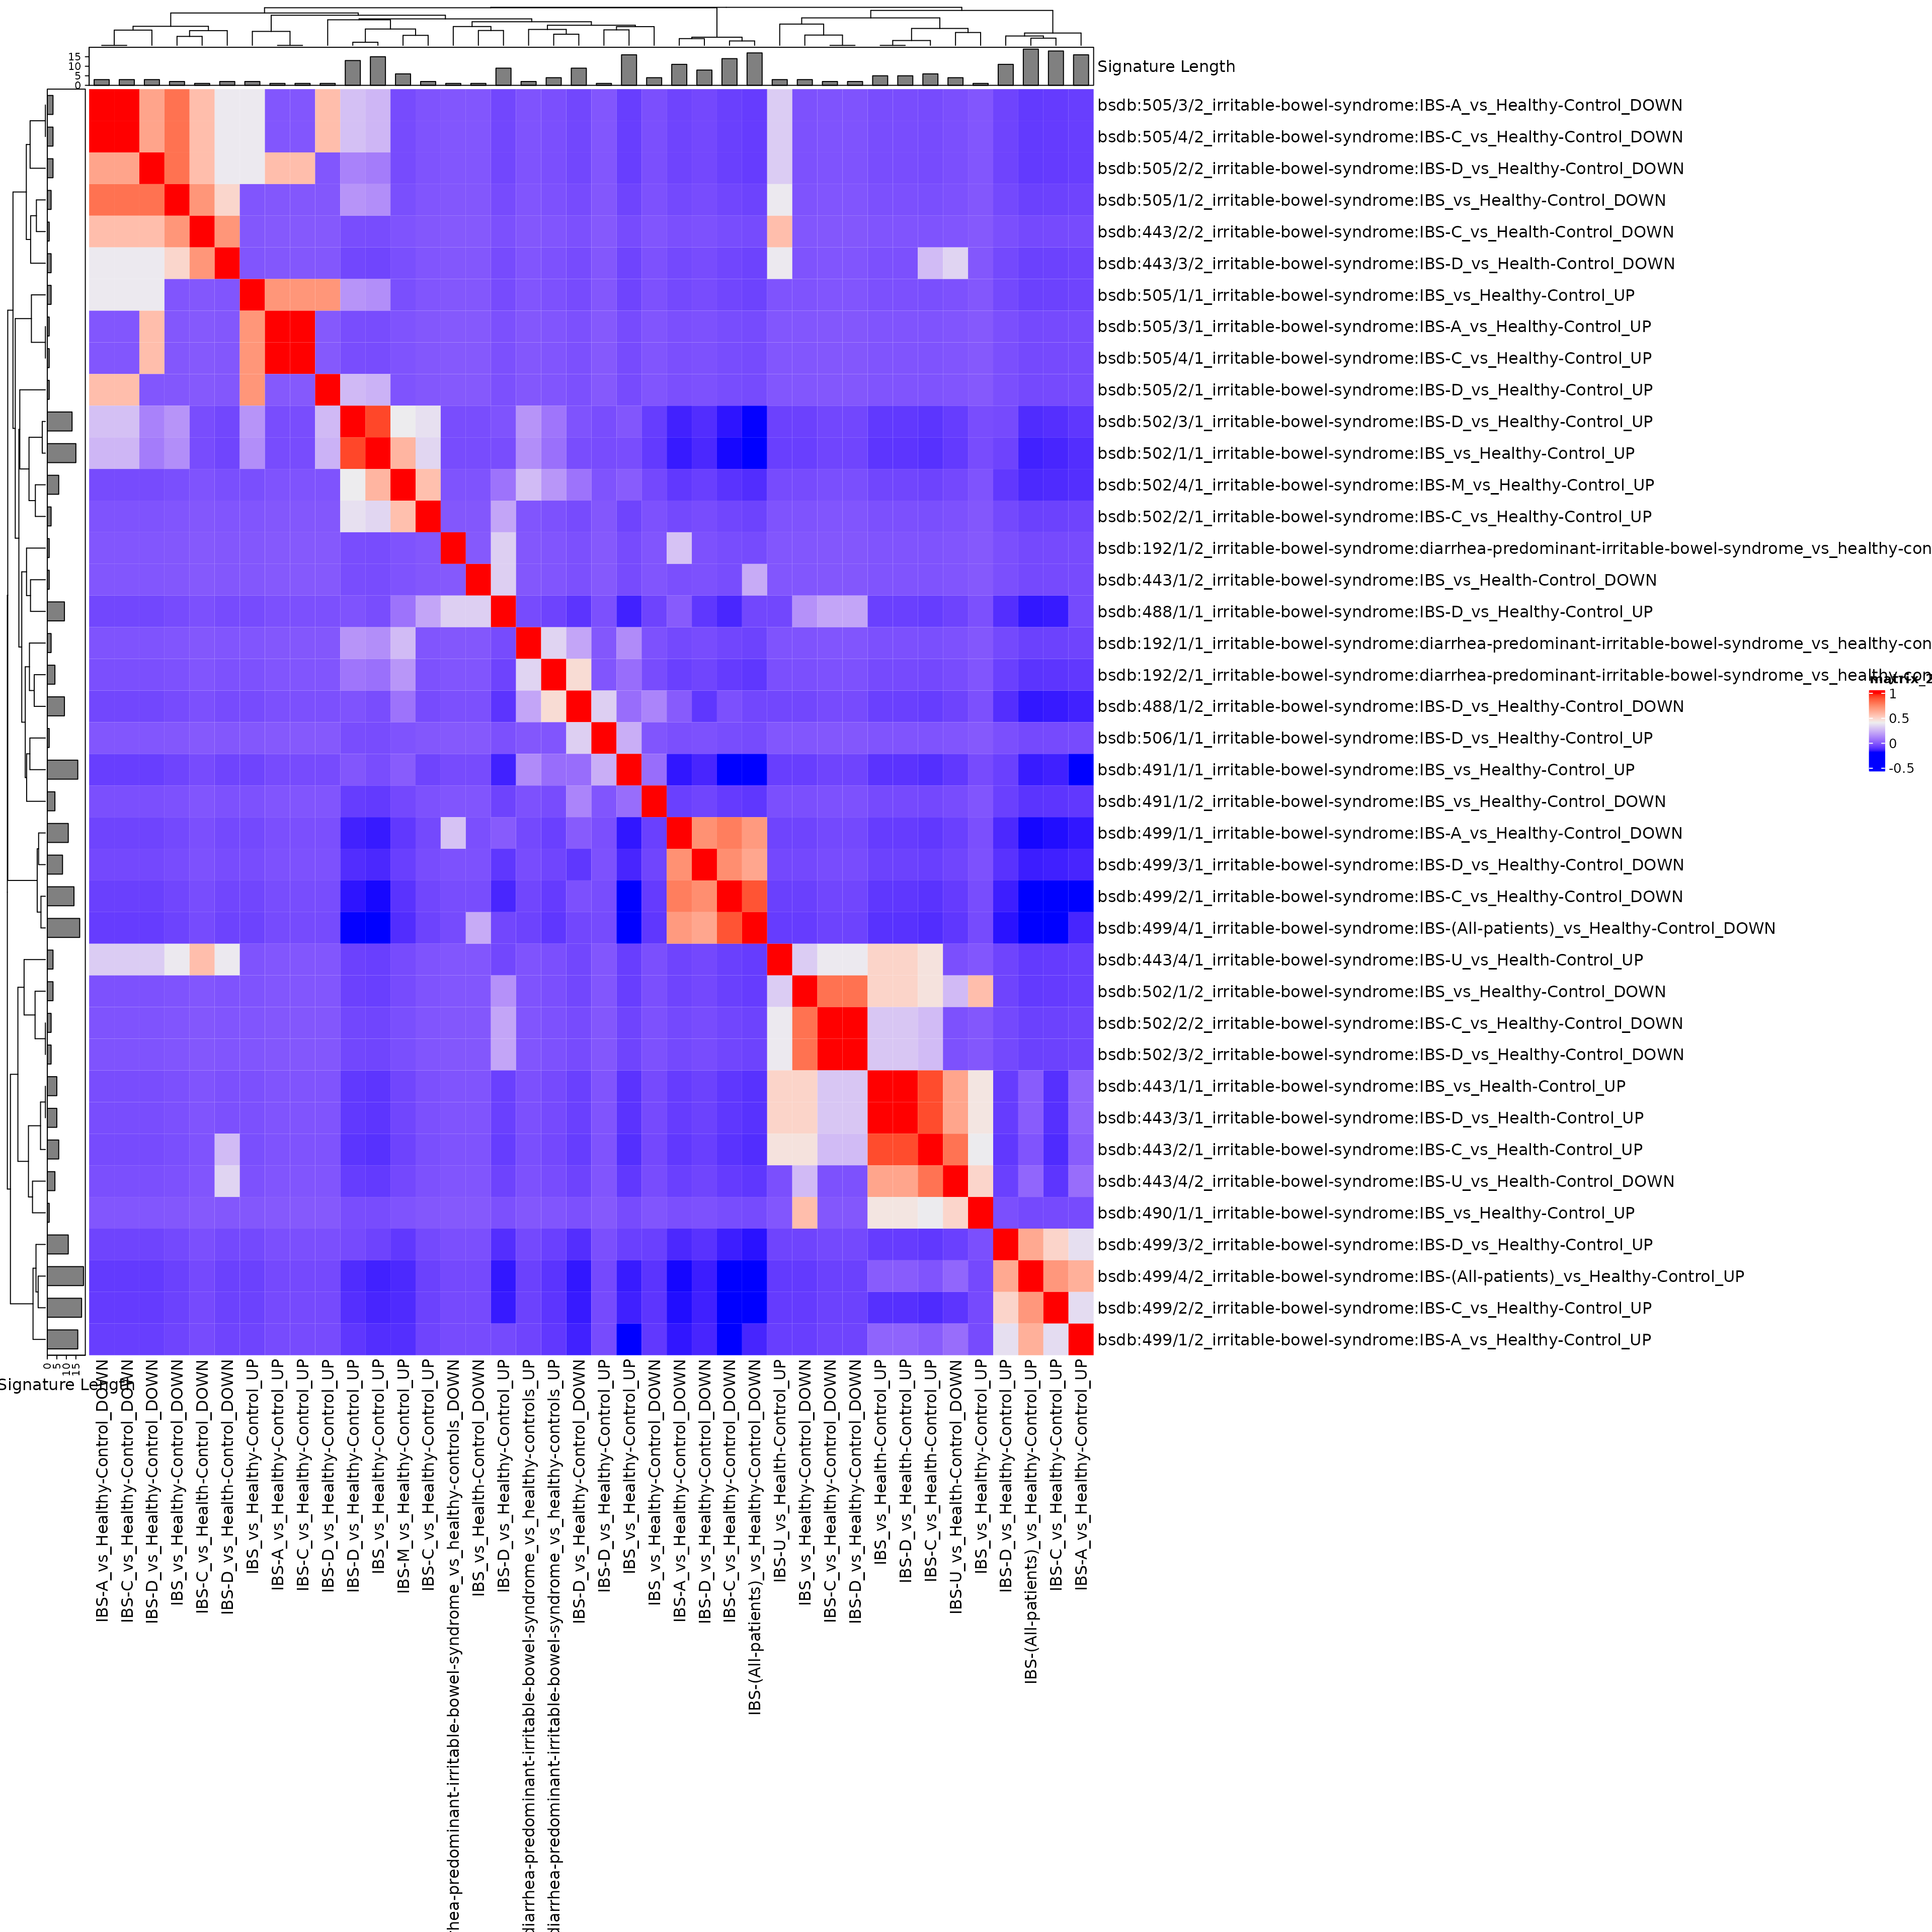
Use this interactively to make an interactive heatmap:
library(InteractiveComplexHeatmap)
hm <- draw(hm)
htShiny(hm)