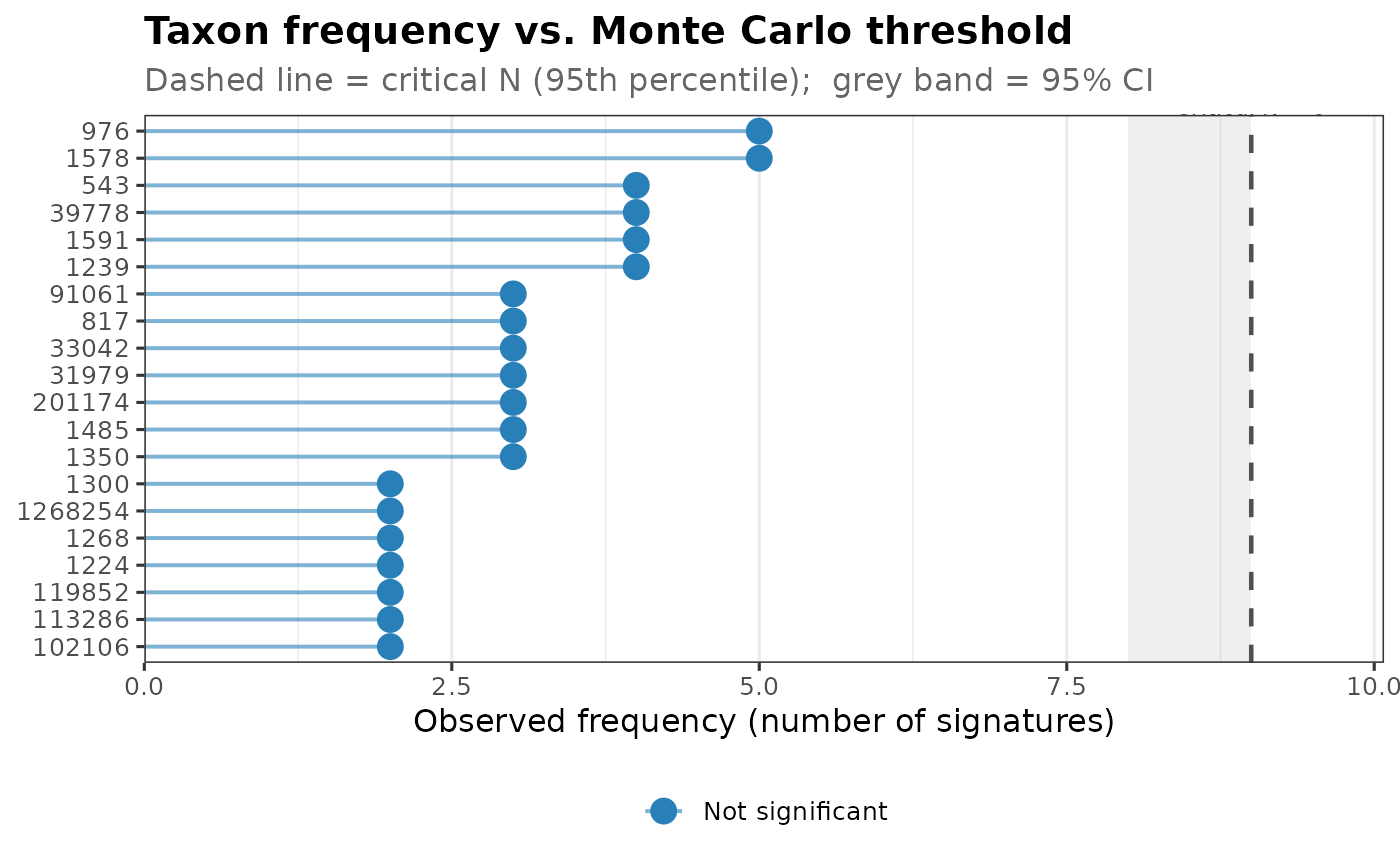
Flag taxa whose observed frequency exceeds the Monte Carlo critical threshold
Source:R/montecarlo.R
significantTaxa.RdCompares observed taxon frequencies (via frequencySigs) against
the critical threshold from getCriticalN, and optionally
plots the result as a lollipop or bar chart.
Usage
significantTaxa(
  sigs,
  cn_result,
  n = 20,
  plot = TRUE,
  plot_type = c("lollipop", "bar"),
  title = "Taxon frequency vs. Monte Carlo threshold"
)
Arguments
- sigs
a list of signatures, such as produced by getSignatures
- cn_result
the list returned by
getCriticalN- n
number of top taxa to consider (default: 20)
- plot
logical; if TRUE (default), draw a plot of observed frequency vs. critical N
- plot_type
one of "lollipop" (default) or "bar"
- title
plot title
Value
(invisibly) a data.frame, one row per taxon, ordered by decreasing
count: taxon, count, critical_n, significant
(count > critical_n), and p_empirical, the empirical chance of
seeing a count this high in the null simulations. Also prints a ggplot2
figure if plot = TRUE.
Examples
full.dat <- bugsigdbr::importBugSigDB()
#> Using cached version from 2026-11-09 16:28:46
my.dat <- full.dat[full.dat$Curator == "Mst Afroza Parvin", ]
relevant.dat <- full.dat[full.dat$`Body site` %in% my.dat$`Body site`, ]
relevant.sigs <- bugsigdbr::getSignatures(my.dat)
my.sigs.increased <- relevant.sigs[grep("UP", names(relevant.sigs))]
my.siglengths <- sapply(my.sigs.increased, length)
cn_res <- getCriticalN(relevant.sigs, my.siglengths)
significantTaxa(my.sigs.increased, cn_res)
#> Warning: Vectorized input to `element_text()` is not officially supported.
#> ℹ Results may be unexpected or may change in future versions of ggplot2.